Creating Alert Rules
This section describes how to create a new alert rule for a model. First navigate to the model's dashboard page, then
select the "Alerts" tab, and click on the "MANAGE ALERT RULES" gear in the upper right corner of the table.
Next, in the Manage Alert Rules page, click the "NEW ALERT RULE" button in the upper right corner. This will open the form to create a new alert rule.
In this form, enter the following:
- A name for the alert rule
- A name for the metric the alert rule will check - for example, "Hallucination Rate" or "Inference Count"
- An optional description
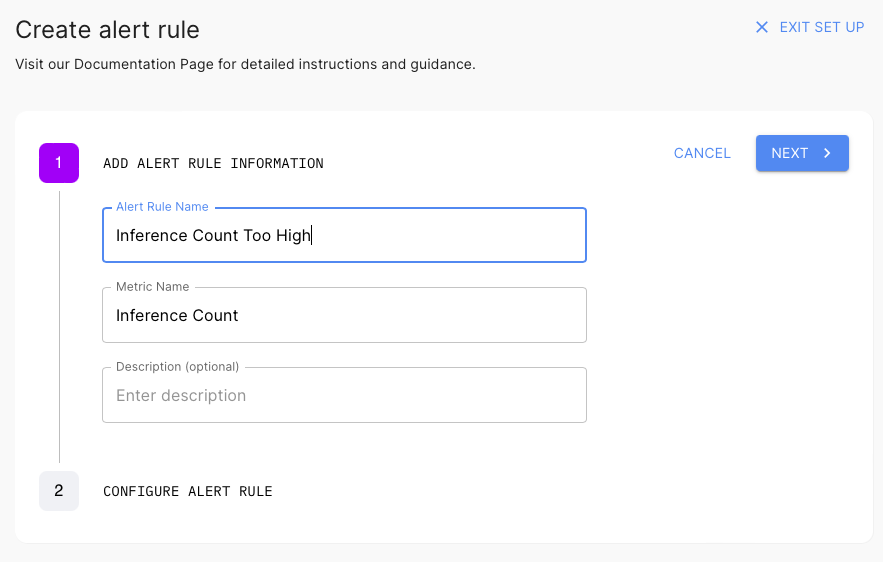
Then click "NEXT". This will take you to the form to set the alert rule's query, threshold, and bound.
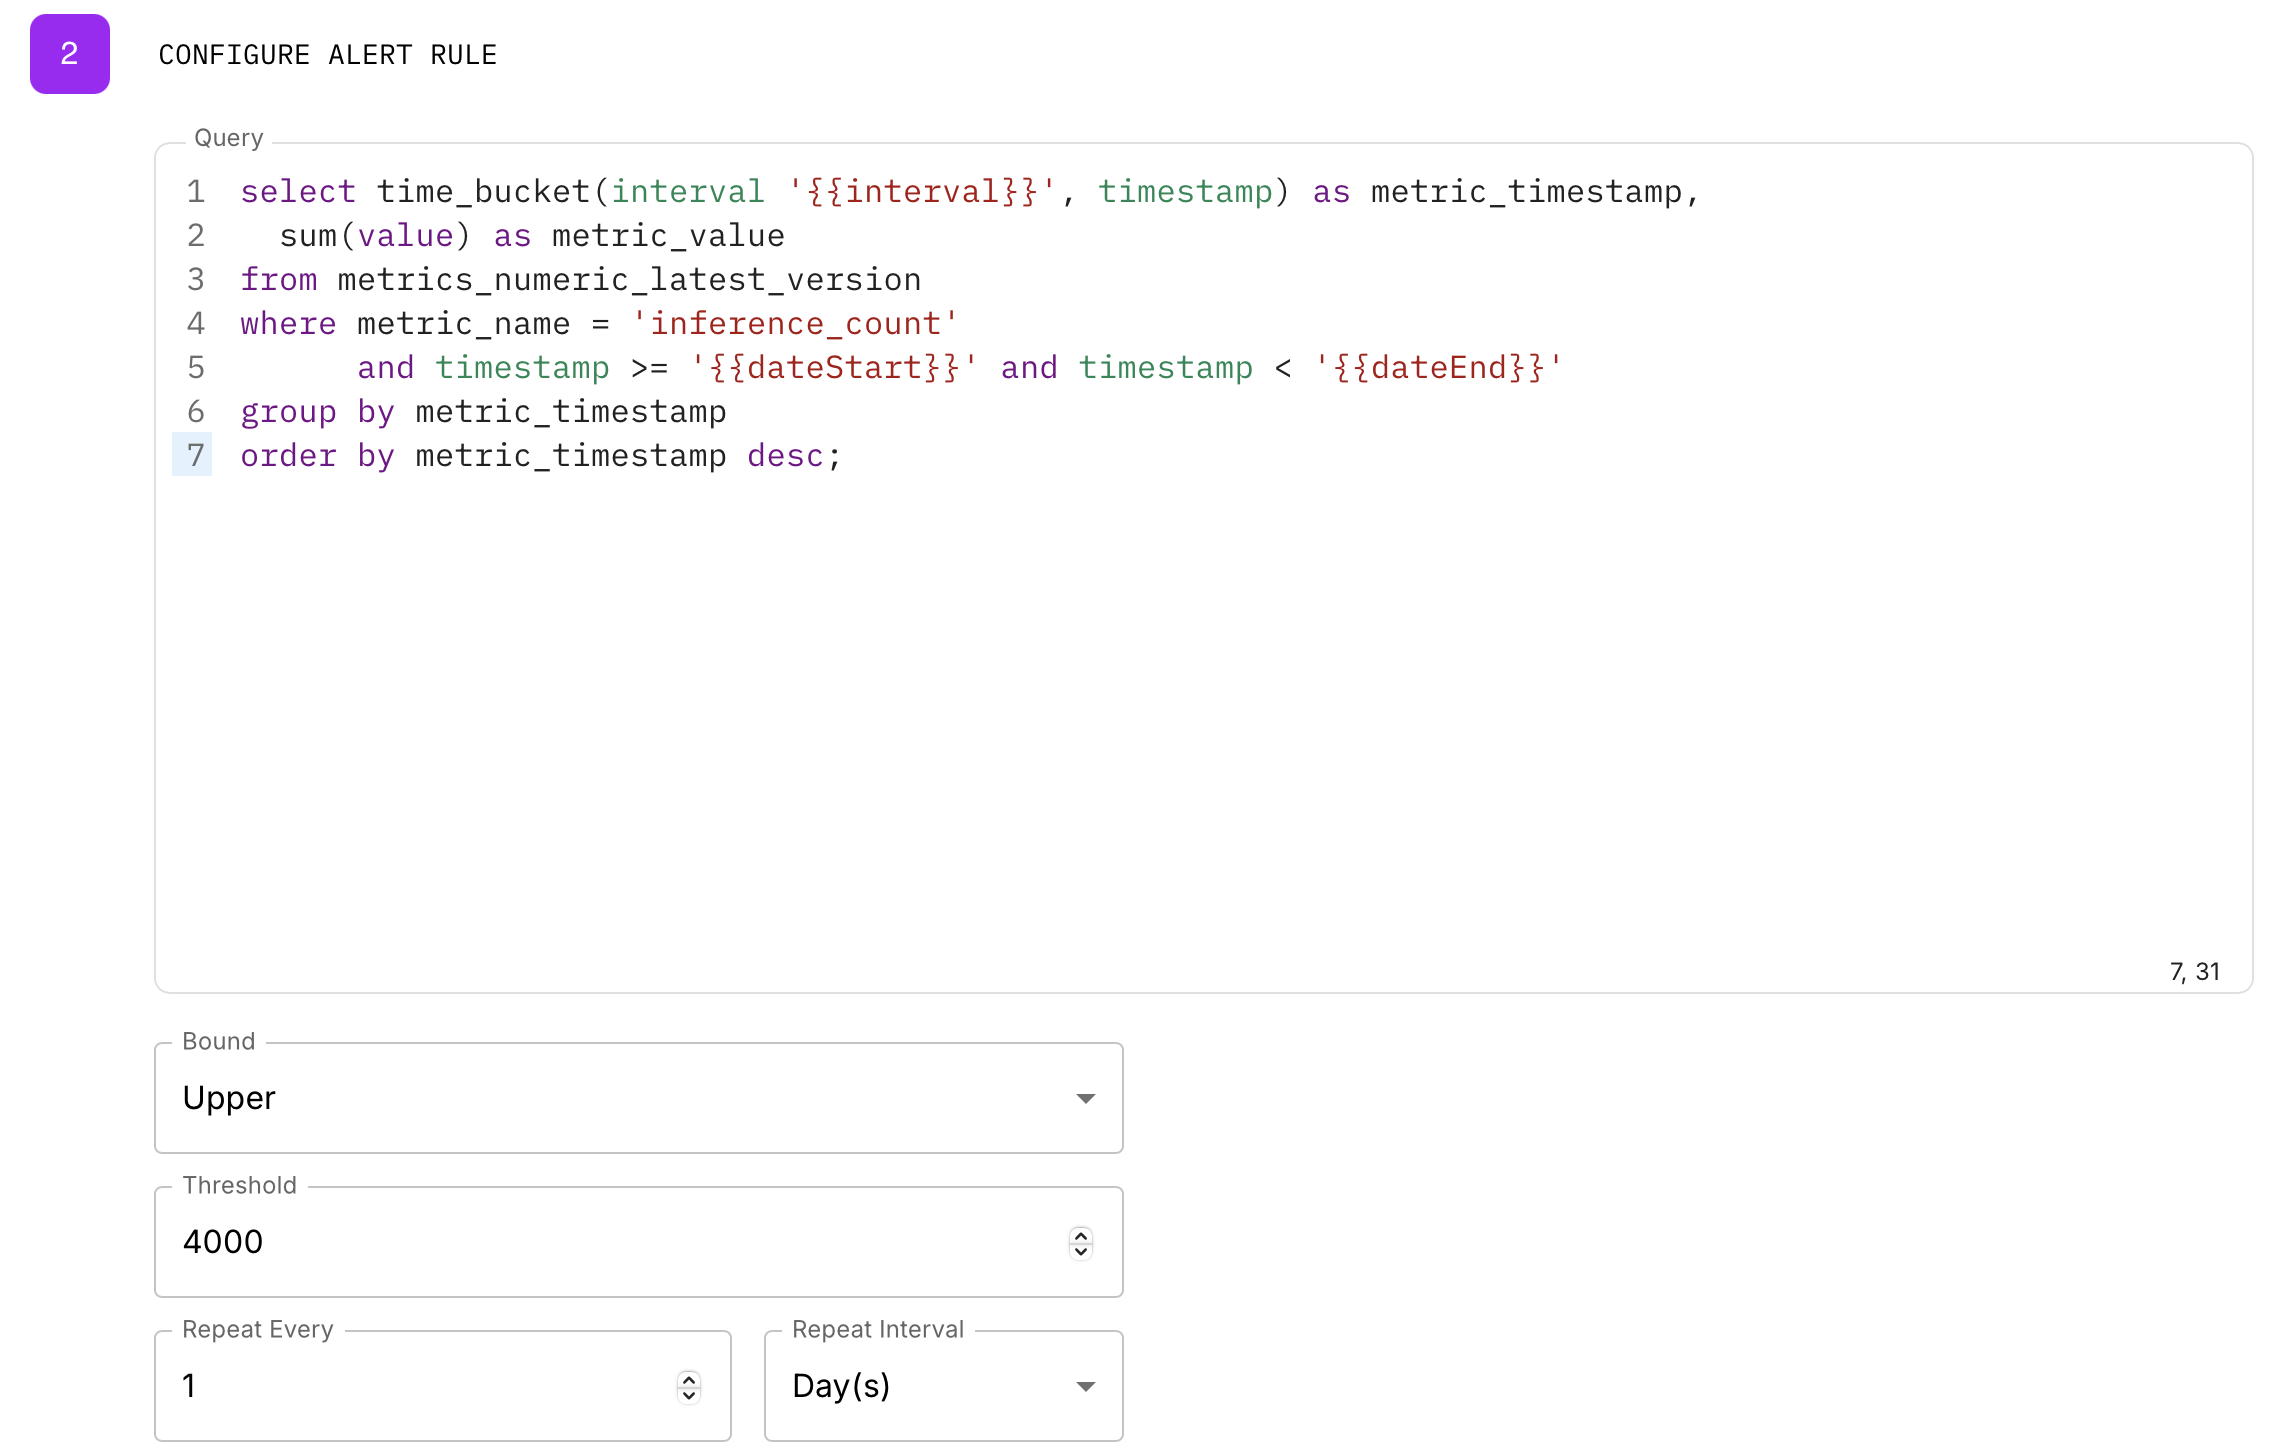
For the purposes of this example, enter this inference count query, which will calculate the count of the number of
inferences every day.
select time_bucket(interval '{{interval}}', timestamp) as metric_timestamp,
  sum(value) as metric_value
from metrics_numeric_latest_version
where metric_name = 'inference_count'
      and timestamp >= '{{dateStart}}' and timestamp < '{{dateEnd}}'
group by metric_timestamp
order by metric_timestamp desc;
Note 1: all alert rule queries must return a metric_timestamp and metric_value column for the alert to be properly checked. The query may return additional columns that will be recorded as metadata on the alert object. These additional alert metadata fields can be used to create alert rules that operate on many subsets of a metric, and the reported alerts will contain the subset that triggered the threshold.
Note 2: all alert queries require placeholder templates in order for Arthur to use them. Alert rule queries must include at least one condition in a WHERE clause that depends on each of '{{dateStart}}' and '{{dateEnd}}'. These placeholders will be used to filter the metrics down to the time range of interest to the alert rule or metrics calculation job. Additionally, the queries must use '{{interval}}' placeholder in the first argument of the time aggregation functions. For example, either of the time_bucket('{{interva}}', timestamp) or time_bucket_gapfill('{{interva}}', timestamp) functions are used to aggregate a time interval of data for the alert.
Note 3: if you're configuring an alert rule over a custom aggregation, it's a good idea to specify the version
of the aggregation you're configuring in the query. That way if new versions are created, you'll know which one
generated past alerts by checking the dimensions of the alert. You can do this by adding
dimensions ->> 'aggregation_version' to the SELECT clause.
Example
For this example, we want to raise an alert when there is a lot of load on our model, so we can trigger scaling actions in our downstream system. To do this, set the Bound to "Upper", the Threshold to 4000, and the Repeat Every to 1 Day(s). This setting means that any day with more than 4000 inferences will cause this alert to trigger.
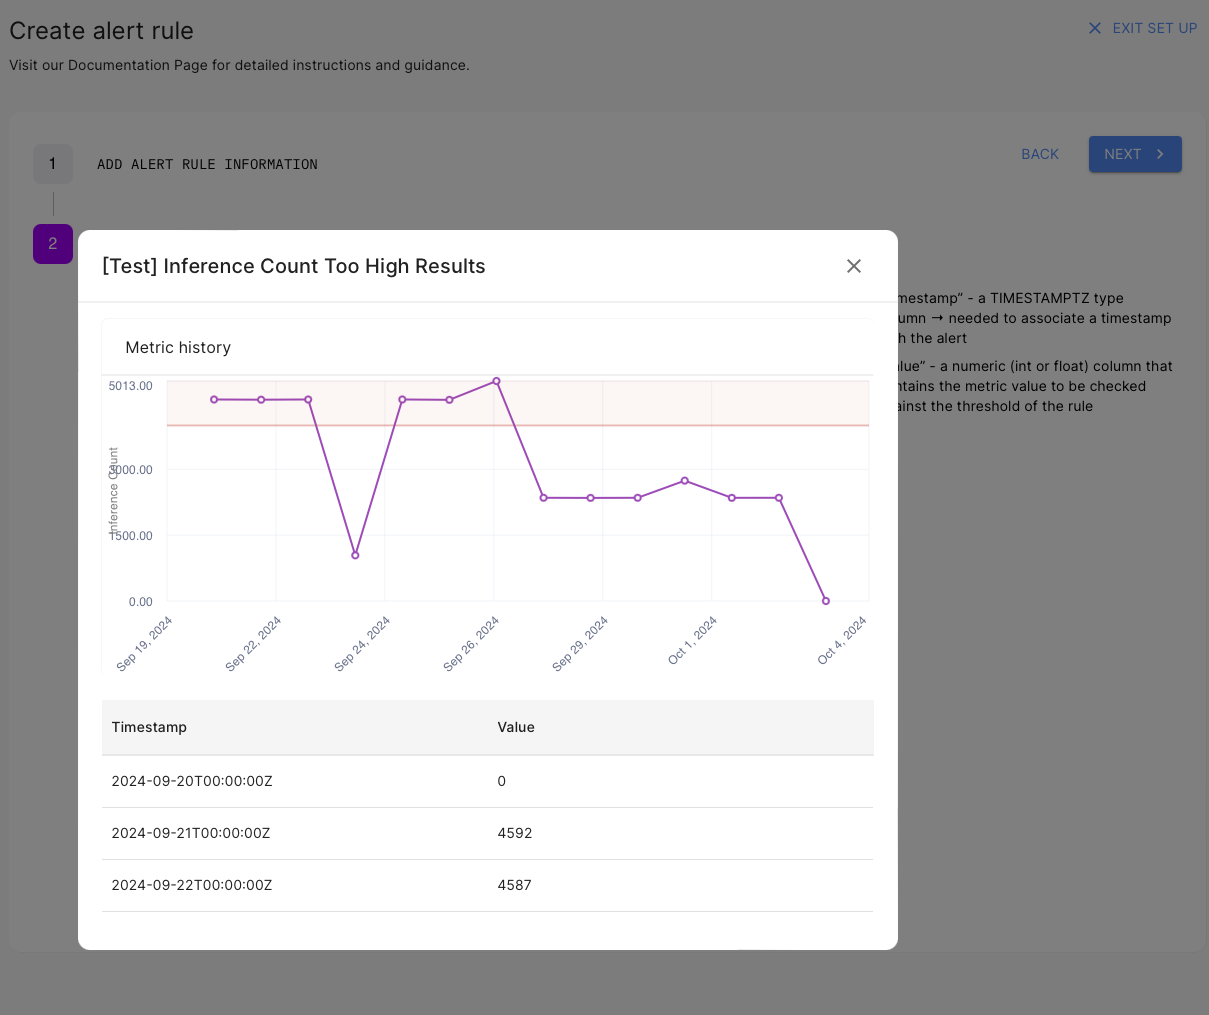
Next, test the alert by clicking "TEST ALERT RULE". This will execute the query and return the last 14 days of the
metric to compare with an overlaid threshold region. It will also show a table of points that make up the results. It
should look something like this:
Next, exit the test graph modal, and click "NEXT". On the final review page, confirm the alert rule looks as expected,
then click "CREATE" and the alert rule will be checked the next time metrics are retrieved for this model.
Receive Alerts
Arthur's alerting functionality sends webhook events whenever an alert is triggered. To configured a webhook, see the guide in How Do Webhooks Work in Arthur?.
Once you have a webhook created in your workspace, add it to your Alert Rule using the Notification Webhooks field to receive notifications when that alert rule triggers.
Updated 10 months ago