Custom Metrics
This document provides an overview of the custom metrics feature in Arthur. For additional information on querying metrics and the storage of metrics in Arthur, see the Metrics & Querying Overview guide.
Overview
Arthur Custom Metrics let you define model- or business-specific metrics using SQL. Custom metrics are evaluated during metrics calculation jobs and appear alongside Arthur’s built-in metrics in dashboards, plots, comparisons, and alerts.
Custom metrics are:
- Reusable across multiple models and projects
- Versioned, so you can evolve metric logic while preserving historical results
- Queryable, just like any other Arthur metric
Each custom metric produces time-series data with the format:
(Model ID, Metric Name, Timestamp, Value, Dimensions)
For more on how these fields are stored and queried, see the
Metrics & Querying Overview .
Arthur also supports custom metric versioning. When you create a new version of a custom metric, existing models will continue to use the previous version until you explicitly update their metric configuration. This gives you a precise audit trail of which query and aggregation logic produced any historical time series.
Custom metrics are built around four core components:
- SQL Query – How the metric is computed from your data
- Description – Human-readable explanation of what the metric means
- Reported Metrics – Numeric outputs from your SQL query
- Aggregate Arguments – Templated parameters that make the metric reusable across datasets and models
Once defined, custom metrics fit into the broader Arthur metrics ecosystem:
Datasets (ML & GenAI)
    ↓
[SQL Query] → Reported Metrics
    ↓
[Metrics Engine & Aggregations]
    ↓
Dashboards • Alerts • Metrics Query UI
Custom metrics are model-agnostic: they can capture metrics for binary/multiclass classification, regression, GenAI/LLM, decisioning systems, and business KPIs.
Quickstart Guide
In this quickstart, we’ll walk through configuring a custom metric that counts records in a category (a simple “category count” metric). This illustrates all four building blocks:
- SQL query
- Aggregate arguments
- Reported metrics
- Model metric configuration
Step 1: Write the SQL
Start by defining the SQL query that computes your metric. In this example, we’ll count records for a given categorical value over 5-minute buckets:
SELECT
    time_bucket(INTERVAL '5 minutes', {{timestamp_col}}) AS ts,
    '{{categorical_value_literal}}' AS categorical_value,
    COUNT(*) AS count
FROM {{dataset}}
WHERE {{categorical_column}} = '{{categorical_value_literal}}'
GROUP BY ts, categorical_value;
Callouts:
-
Templated variables
Any generic argument is written using{{variable_name}}syntax. These are the aggregate arguments that users configure when adding the metric to a model (e.g., which dataset, which timestamp column, which categorical value). -
Dimension columns
We includecategorical_valuein both theSELECTandGROUP BYclauses. This value will later be used as a dimension in the output time series (so you can tell which category the count belongs to). -
Time bucketing
We use thetime_bucketfunction to aggregate counts into 5-minute intervals. For numeric metrics, your query should produce a bucketed timestamp column so Arthur can align metric values to the standard 5-minute cadence.
Step 2: Configure the Aggregate Arguments
In the Custom Metric UI, configure an aggregate argument for each templated variable in your SQL query (everything inside {{}}).
You will typically define:
- A dataset argument for
{{dataset}} - A timestamp column argument for
{{timestamp_col}} - One or more column arguments for fields like
{{categorical_column}} - Optional literal arguments for values like
{{categorical_value_literal}}
These arguments make your metric reusable across different models and datasets.
🛈 The timestamp and dataset arguments are used by every custom metric. They identify:
- Which dataset to query
- Which column contains record timestamps
Clear names, types, and descriptions help other users know how to configure your metric correctly.
Step 3: Configure the Reported Metrics
Next, configure the reported metrics that Arthur will store from your query.
For our category count example, we’ll define:
- Value column:
count - Metric name: a descriptive name for the time series (e.g.
category_count) - Timestamp column:
ts - Dimension columns:
categorical_value
Each reported metric tells Arthur how to interpret a single time series in the output:
- Which column is the metric value
- Which column is the timestamp
- Which columns become dimensions in the
dimensionsfield
Arthur uses this metadata to store and serve time series for use in dashboards, alerts, and queries.
You can query reported metric values directly using the Metrics Query UI. This is especially helpful for validating your SQL output and inspecting bucket-level values. See Metrics & Querying Overview .
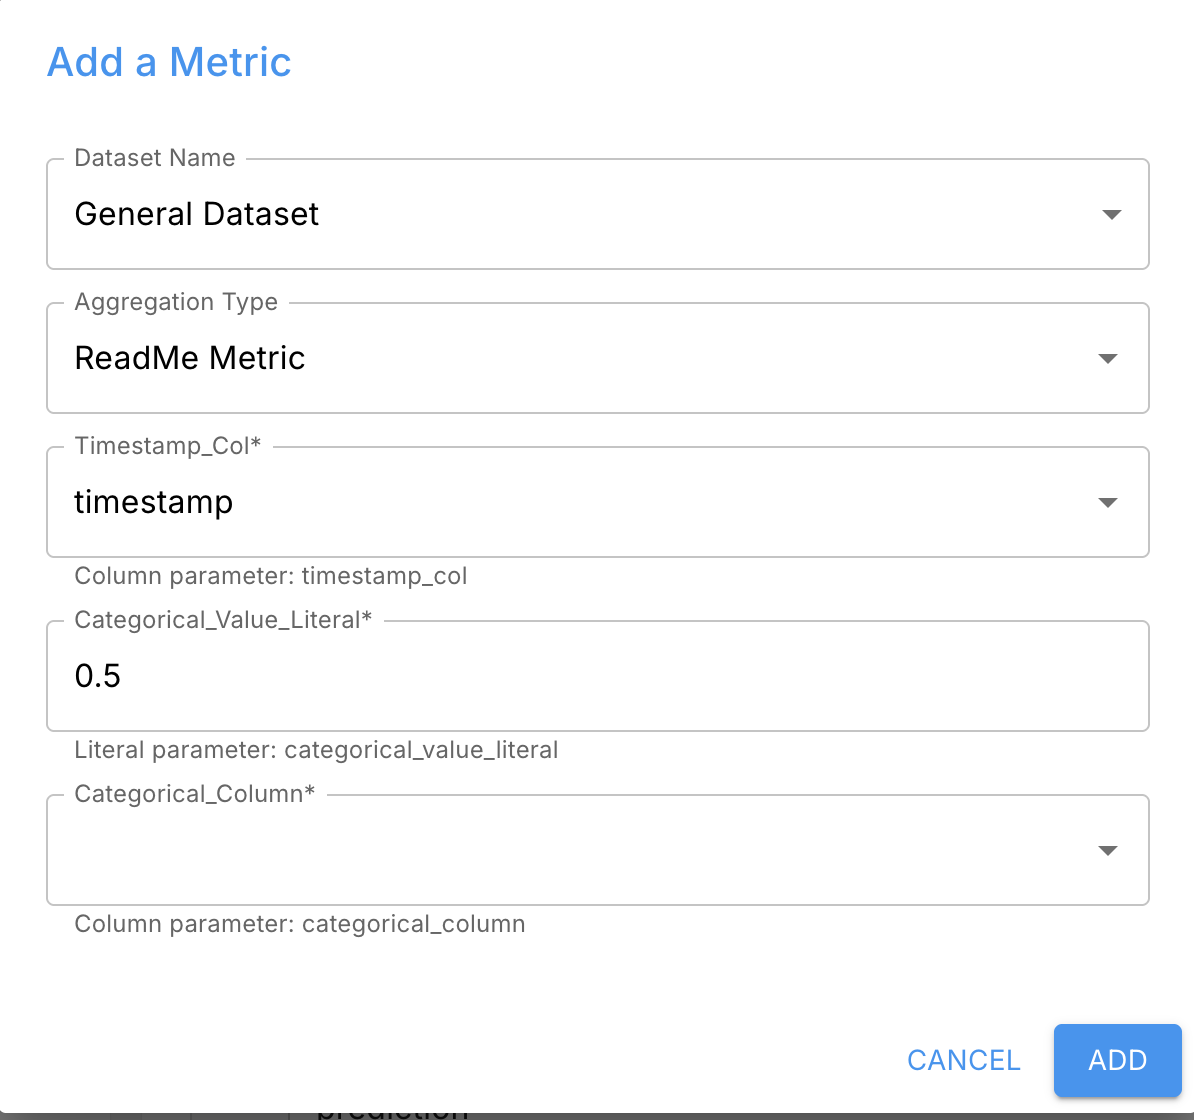
Step 4: Add the Metric to Your Model Metric Configuration
Finally, add your custom metric to a model:
- Go to your model’s metric configuration
- Select the custom metric you created
- Fill in the aggregate arguments:
- Dataset
- Timestamp column
- Column arguments
- Literal thresholds, if applicable
On the next metrics calculation job, your new metric (e.g. category_count) will run and populate time series for that model. You can then:
- Plot it in dashboards
- Query it with SQL via the Metrics Querying interface
- Use it in alert rules
More Details
The sections below describe each part of a custom metric in more depth.
Basic Information
Each custom metric starts with some basic configuration:
-
Name
A user-friendly label shown in the UI. This does not have to match themetric_namein the time series output. -
Description
A human-readable explanation of what the metric measures and how to interpret it. -
Model Problem Type
Optionally, specify which model types the metric applies to (e.g.binary_classification,multiclass_classification,regression,genai). Arthur can use this to suggest relevant metrics when users configure models. -
Versioning
When you edit a custom metric, Arthur creates a new version. Existing models remain pinned to the old version until you update their configuration. This ensures you can always tell which query & aggregation logic produced historical values.
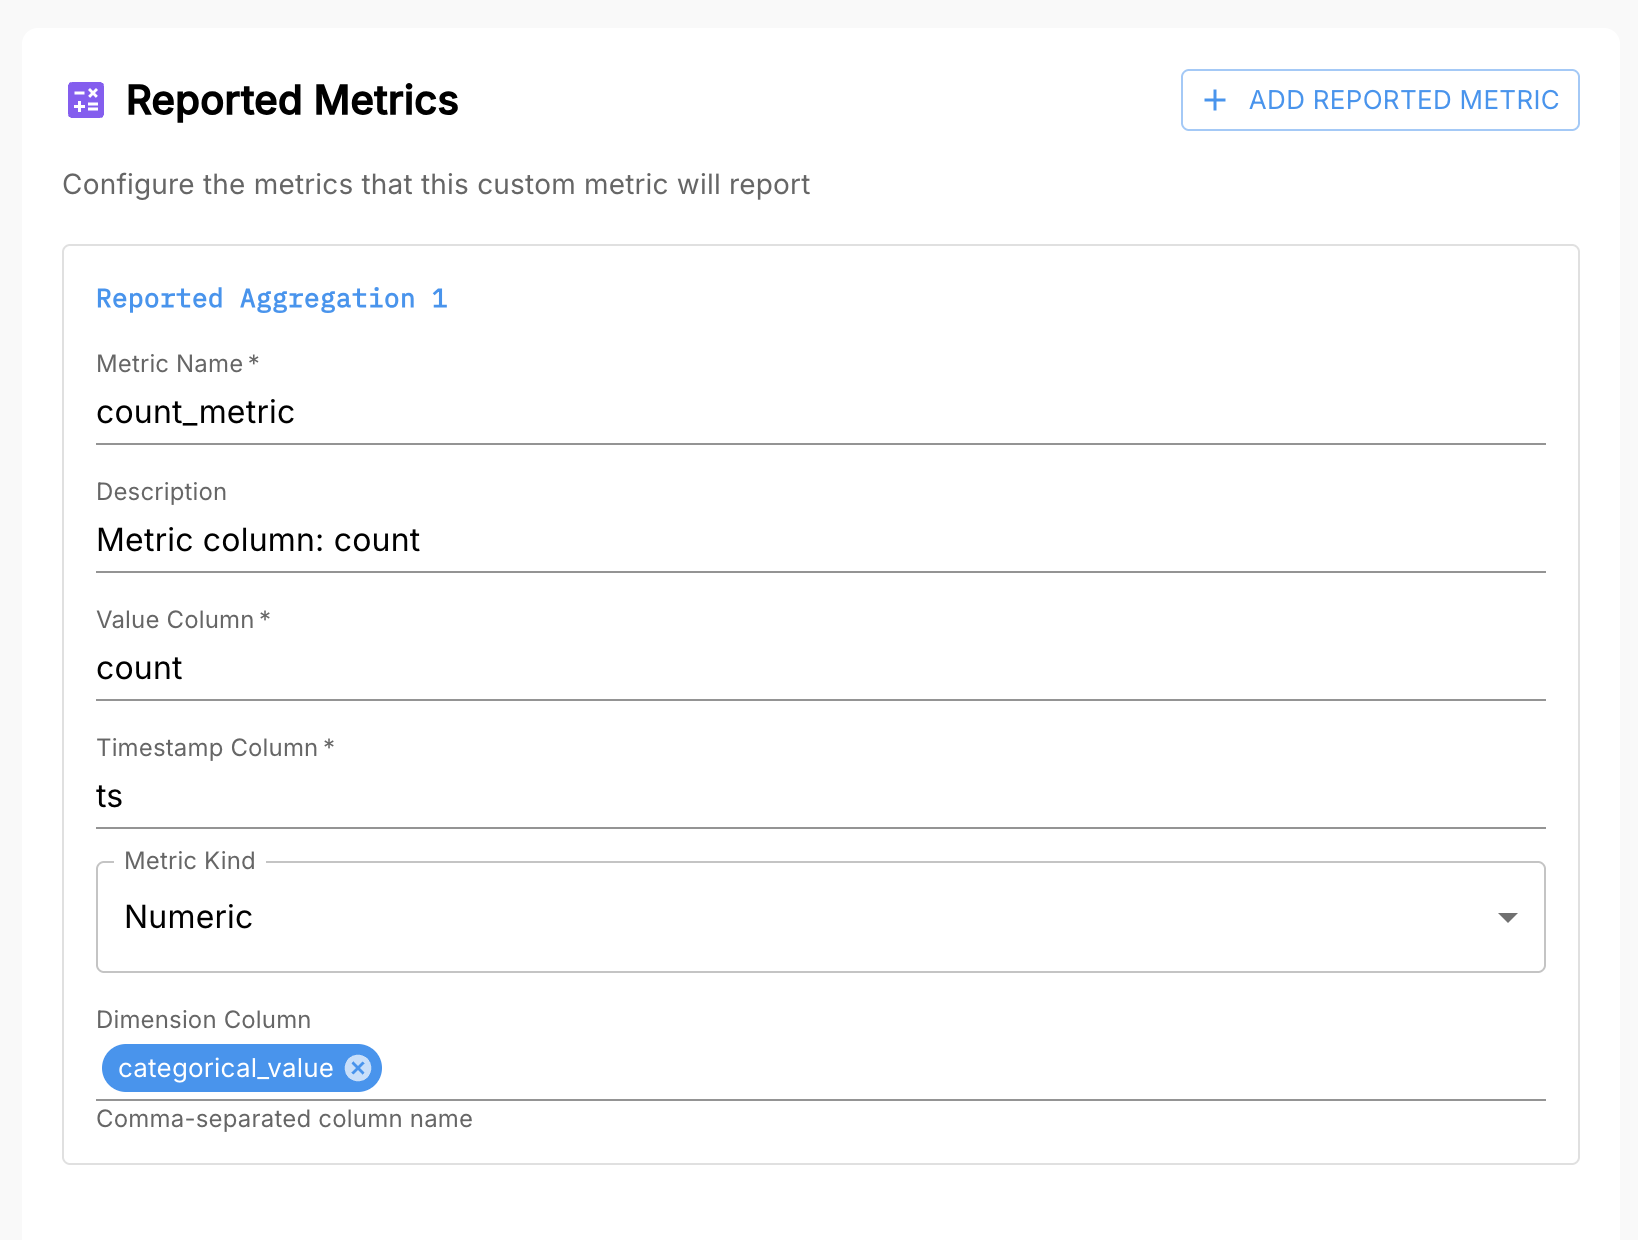
Reported Metrics
A single custom metric can output one or many reported metrics from the same SQL query. This is useful when the same query naturally produces multiple related measurements (e.g., true positives and false positives, or counts for multiple categories).
Each reported metric corresponds to one time series in Arthur’s metrics storage and includes:
-
Metric name
The name used in the metrics tables (themetric_namefield). This is what you’ll filter on when querying metrics in dashboards or the Metrics Query UI. -
Description
A description specific to that particular metric (e.g. “Count of records where prediction = 1”). -
Value column
The column in your SQL query that contains the metric’s value (e.g.count,error_rate). -
Timestamp column
The column that contains the time bucket for the metric (e.g.tsfromtime_bucket(...)). -
Metric kind
Numeric– a floating point valueSketch– a sketch-encoded distribution (used for histograms, latency distributions, etc.)
For more on numeric vs sketch metrics, see the Types of Metrics section of Metrics & Querying Overview.
-
Dimension columns
One or more columns from your SQL query that should become dimensions in the output time series (e.g.categorical_value). These must be in theGROUP BYclause and should have manageable cardinality to avoid explosion in the metrics store.
Aggregate Arguments
Aggregate arguments are templated parameters that make your custom metric configurable and reusable across multiple datasets and models. Anywhere you write {{variable_name}} in your SQL, you’ll define an argument with that name.
Arthur supports three kinds of aggregate arguments:
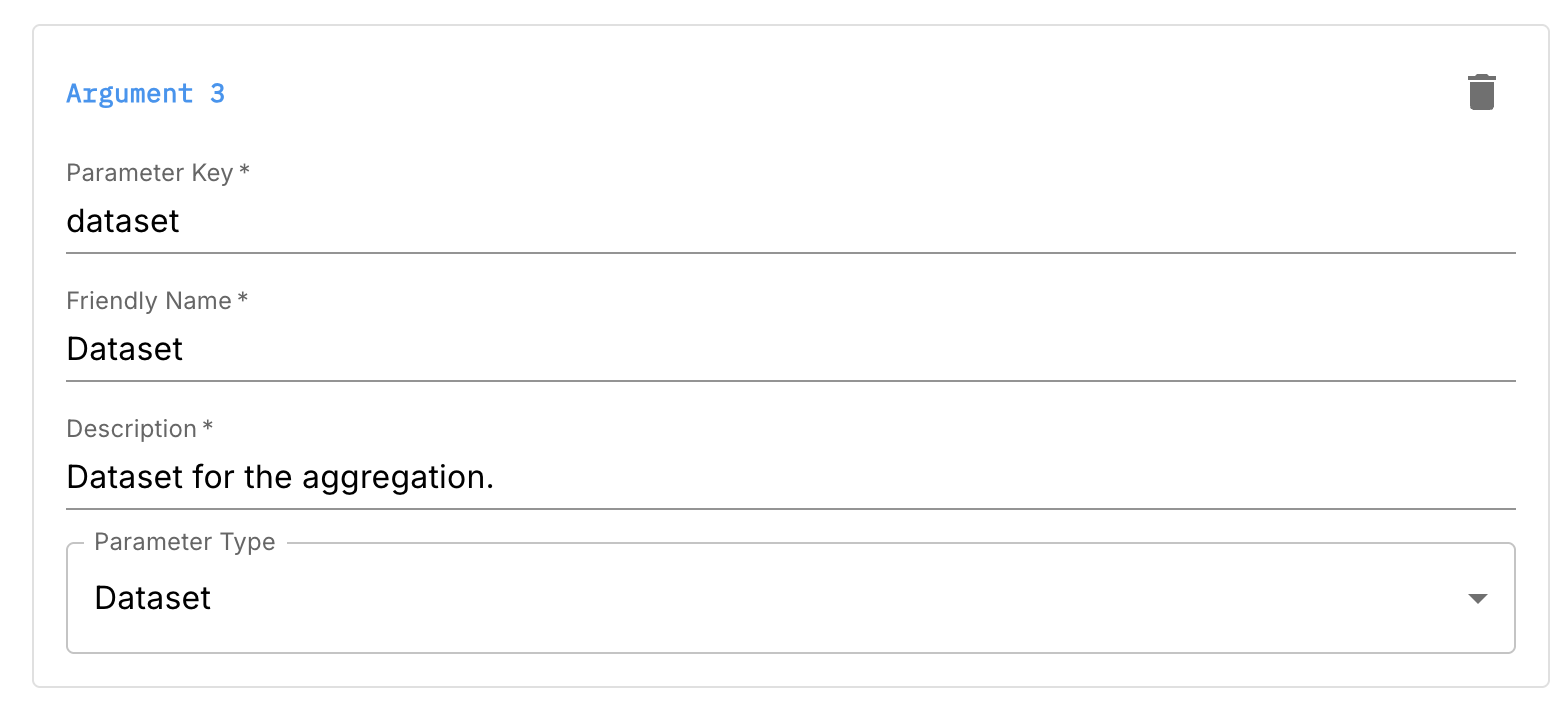
Dataset Arguments
These indicate which dataset the query runs against.
- Parameter key (e.g.
dataset) - Friendly name
- Description
- Parameter type:
Dataset
Your FROM clause should use the templated variable:
FROM {{dataset}}Arthur will automatically provide a dataset argument in the UI; you specify how it should be described and used.
Literal Arguments
Literal arguments represent scalar values you want users to configure, such as thresholds or category values.
Typical use cases:
- Thresholds for pass/fail
- Category names or IDs
- Numeric cutoffs for risk scores
Configuration fields include:
- Parameter key (e.g.
score_threshold) - Friendly name
- Description
- Parameter type:
Literal - Data type (e.g. numeric, string, boolean, timestamp)
Example usage in SQL:
CASE WHEN {{score_threshold}} IS NOT NULL
     AND score > {{score_threshold}}
     THEN 1 ELSE 0 END AS above_threshold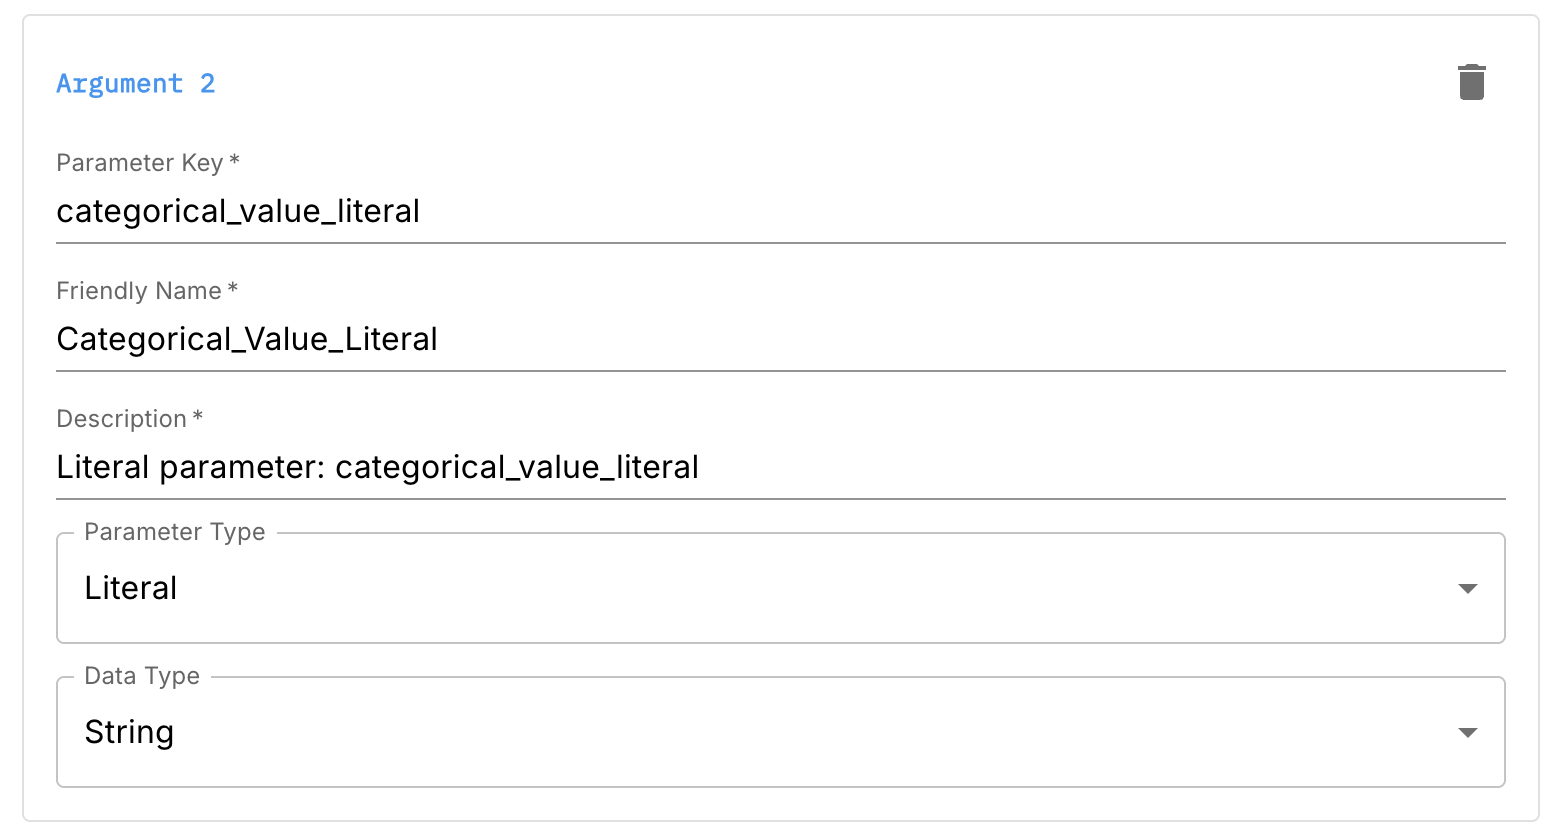
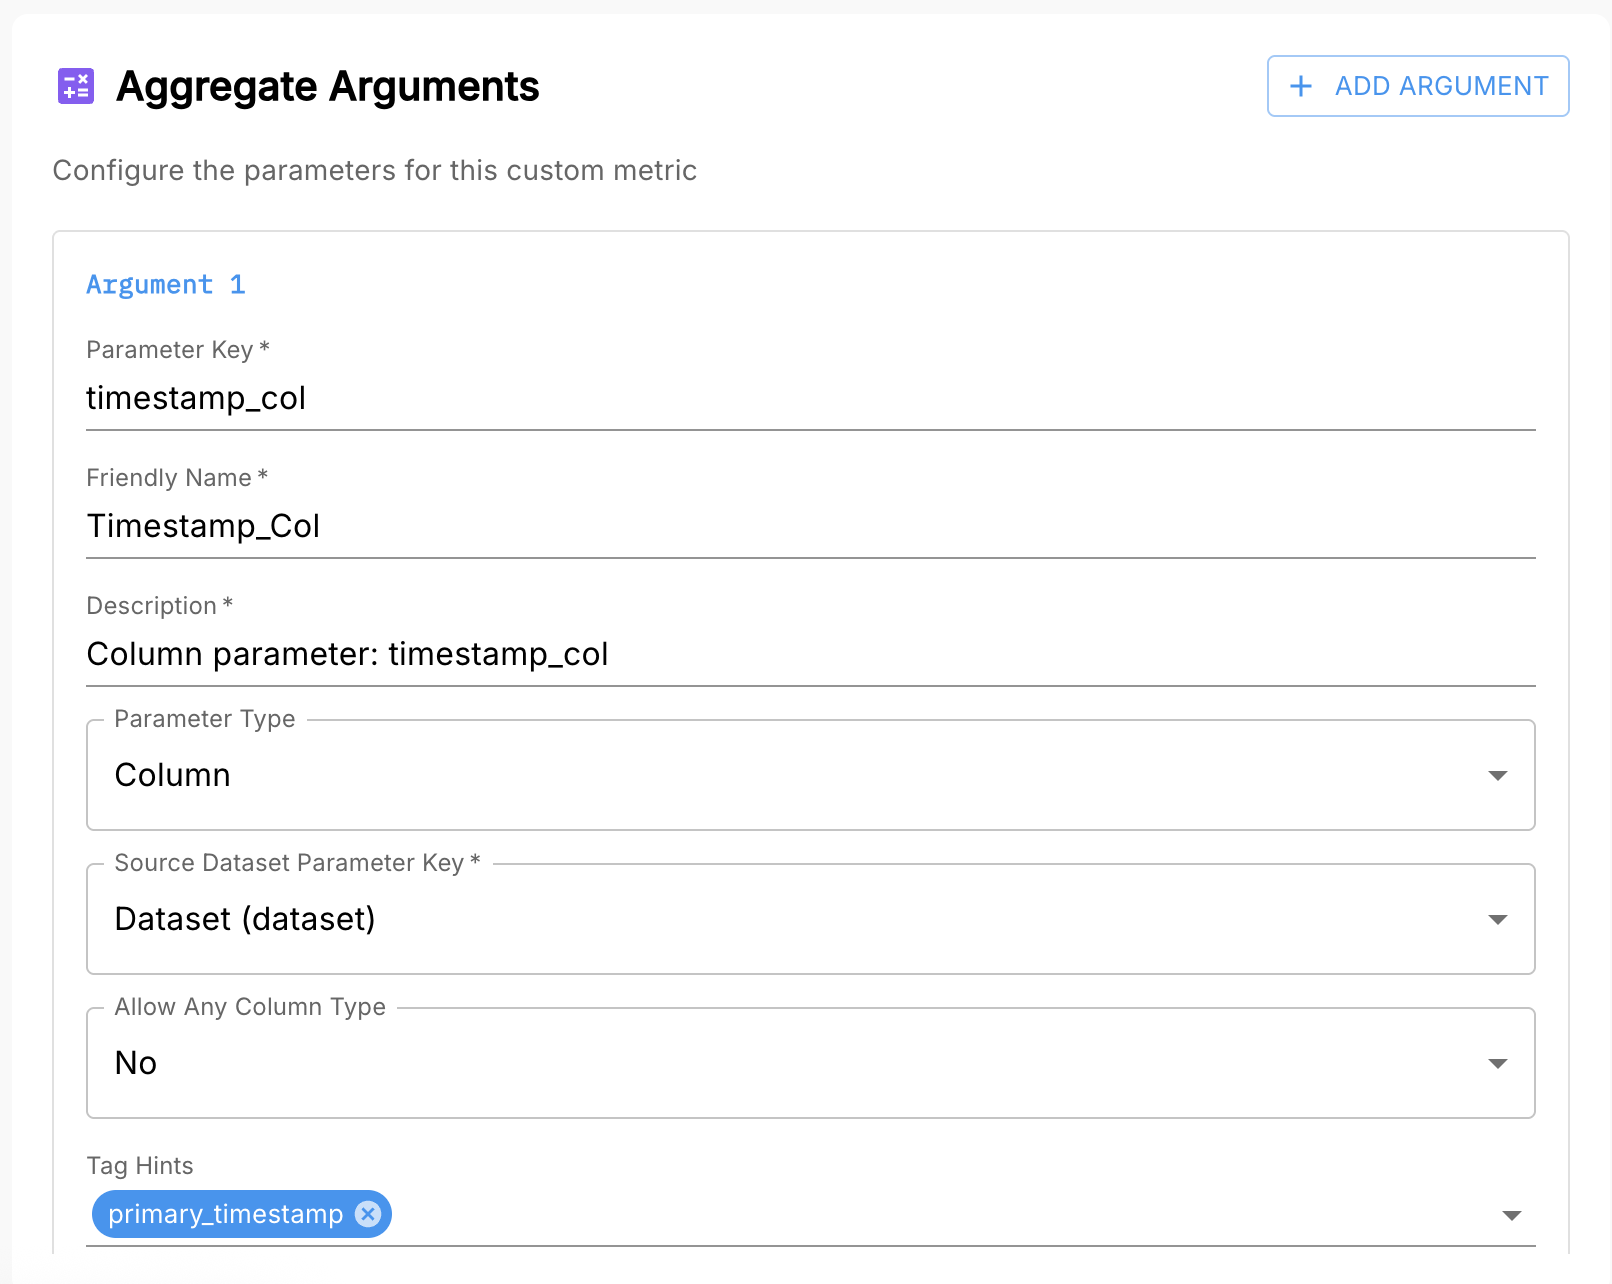
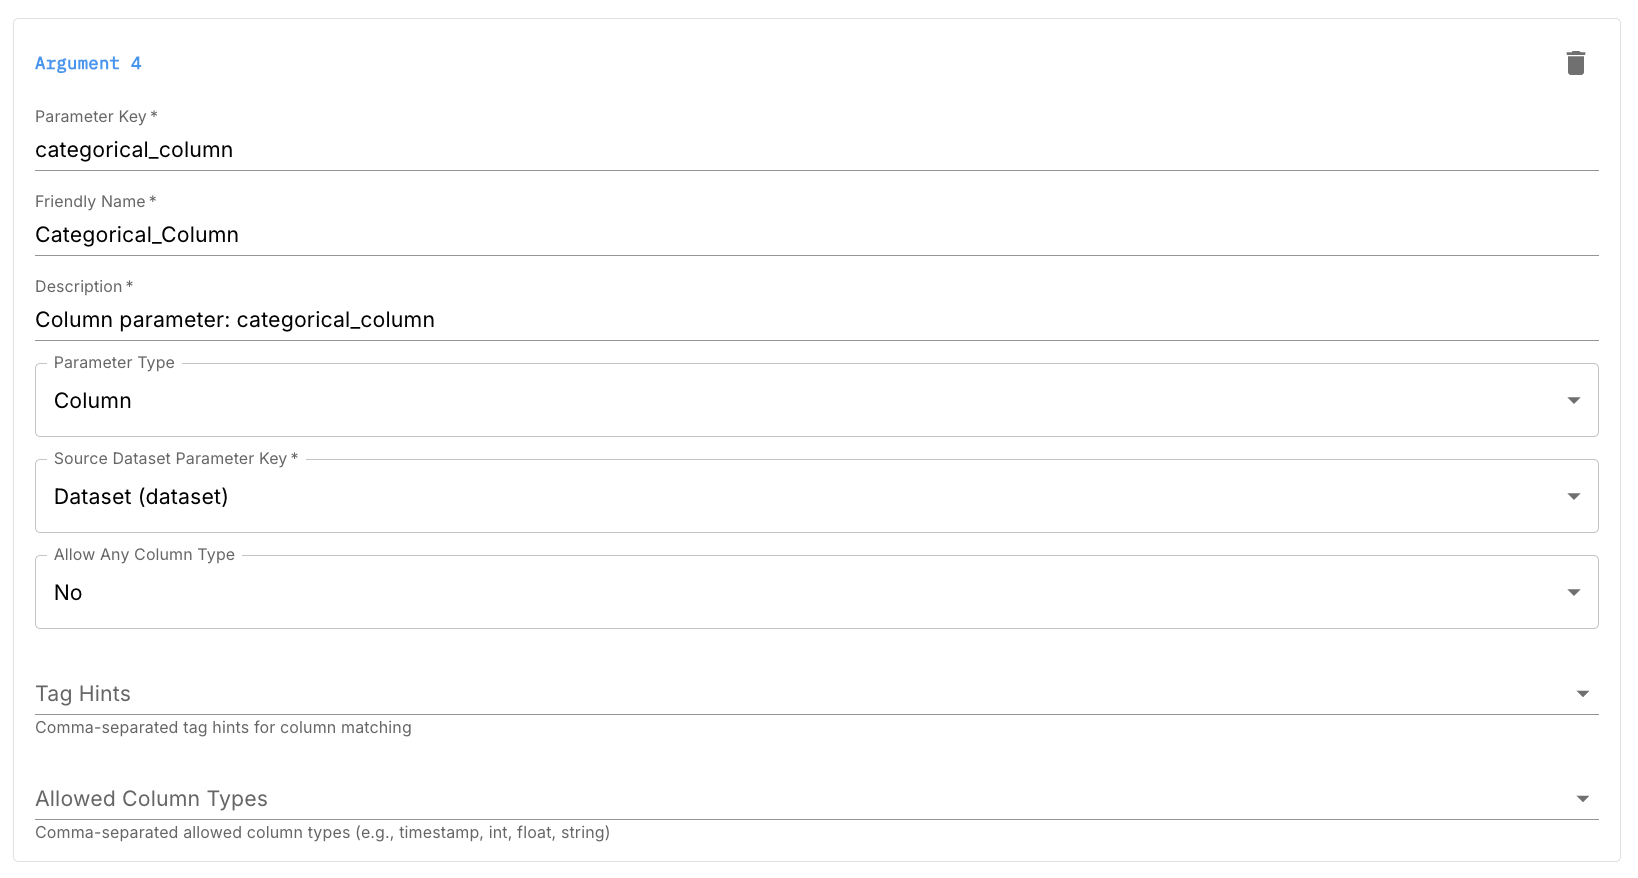
Column Arguments
Column arguments represent column names that the user selects from the dataset. They allow you to reuse the same metric logic for different columns.
Configuration fields include:
- Parameter key (e.g.
timestamp_col,feature_column) - Friendly name
- Description
- Parameter type:
Column - Source dataset parameter key (usually
dataset) - Allowed column types (e.g.
timestamp,numeric,categorical) - Tag hints (e.g.
primary_timestamp,categorical) to guide users
Example usage:
SELECT
    time_bucket(INTERVAL '5 minutes', {{timestamp_col}}) AS ts,
    COUNT(*) AS count
FROM {{dataset}}
GROUP BY ts;
By constraining allowed types and using tags, you help users pick the right column and avoid misconfiguration.
SQL Query
Your SQL query is written in DuckDBSQL, which is very close to PostgreSQL with a few differences. See the DuckDB documentation for detailed syntax and function references.
Requirements:
-
Must be valid DuckDBSQL
-
Must use
{{argument_name}}syntax for all templated values -
Must output all columns referenced in your reported metrics configuration
-
Must produce time series data:
- Numeric metrics: use
time_bucketto aggregate into 5-minute buckets - Sketch metrics: may output per-record values; Arthur handles bucketing
- Numeric metrics: use
Example of using time_bucket:
SELECT
    time_bucket(INTERVAL '5 minutes', {{timestamp_col}}) AS ts,
    COUNT(*) AS record_count
FROM {{dataset}}
GROUP BY ts;
Arthur’s default metrics use 5-minute rollups. You can choose a larger bucket size, but you will lose temporal granularity.
Configuring a Custom Aggregation for Your Model
After you’ve created a custom metric in the workspace:
- Go to your model’s metric configuration
- Add the custom metric to the model
- Provide values for each aggregate argument:
- Dataset
- Timestamp column
- Feature or label columns
- Any literal thresholds or category values
Arthur will substitute the configured values into your SQL by replacing {{variable_name}} with the chosen dataset, column names, or literals at execution time. The metric will then be computed in subsequent metrics calculation jobs and appear alongside all other metrics for that model.
Example – record Count Custom Aggregation
As a complete example, here’s how to define a simple record count custom metric (even though Arthur already provides one out-of-the-box):
SQL query:
SELECT
    time_bucket(INTERVAL '5 minutes', {{timestamp}}) AS ts,
    COUNT(*) AS record_count
FROM {{dataset}}
GROUP BY ts;
Basic information:
- Name: "Record Count”
- Model Problem Type: leave blank (applies to any model type)
Reported metric configuration:
- Metric name:
record_count - Value column:
record_count - Timestamp column:
ts - Metric kind:
Numeric
Aggregate arguments:
- Dataset argument (
dataset) - Timestamp column argument (
timestamp)- Allowed type:
timestamp - Tag hint:
primary_timestamp
- Allowed type:
Once configured for a model, you can:
- Plot
record_countover time - Segment it by dimensions (e.g.
model_version) - Use it in custom dashboards
- Query it via the Metrics Query UI (see Metrics & Querying Overview .)
Troubleshooting
No values appearing for a custom metric
- Verify the SQL query runs and returns rows in the SQL workspace
- Check that value/timestamp columns match your reported metric configuration
- Confirm aggregate arguments are filled in correctly for the model
Metric configuration errors
- Ensure all
{{variables}}used in SQL are defined as aggregate arguments - Confirm column arguments point to columns of compatible types
Unexpected values or trends
- Query the metric directly in the Metrics Query UI to inspect bucket-level values
- Check dimension columns for cardinality issues or unexpected groupings
Additional Resources
-
Metrics & Querying Overview
https://docs.arthur.ai/docs/metrics-querying-overview-1#/ -
Customize Your Dashboard
https://docs.arthur.ai/docs/customize-your-dashboard -
How to Set Up and Track Metrics by Version
https://docs.arthur.ai/docs/how-to-set-up-and-track-metrics-by-version
Updated 8 months ago