
Managing Alerts
Any team that has suffered from alert fatigue knows that alerts are only as good as your ability to manage and take action on them. Knowing this, there are a few ways in which teams can work and interact with alerts within Arthur, all focused on the ability for teams to derive value and track their alerts.
Recent Organization Alert Overview
Upon opening the UI, teams begin to interact with alerts at an organizational level. On the control panel home page, teams can see the most recent critical alerts triggered within their organization and a high-level description.
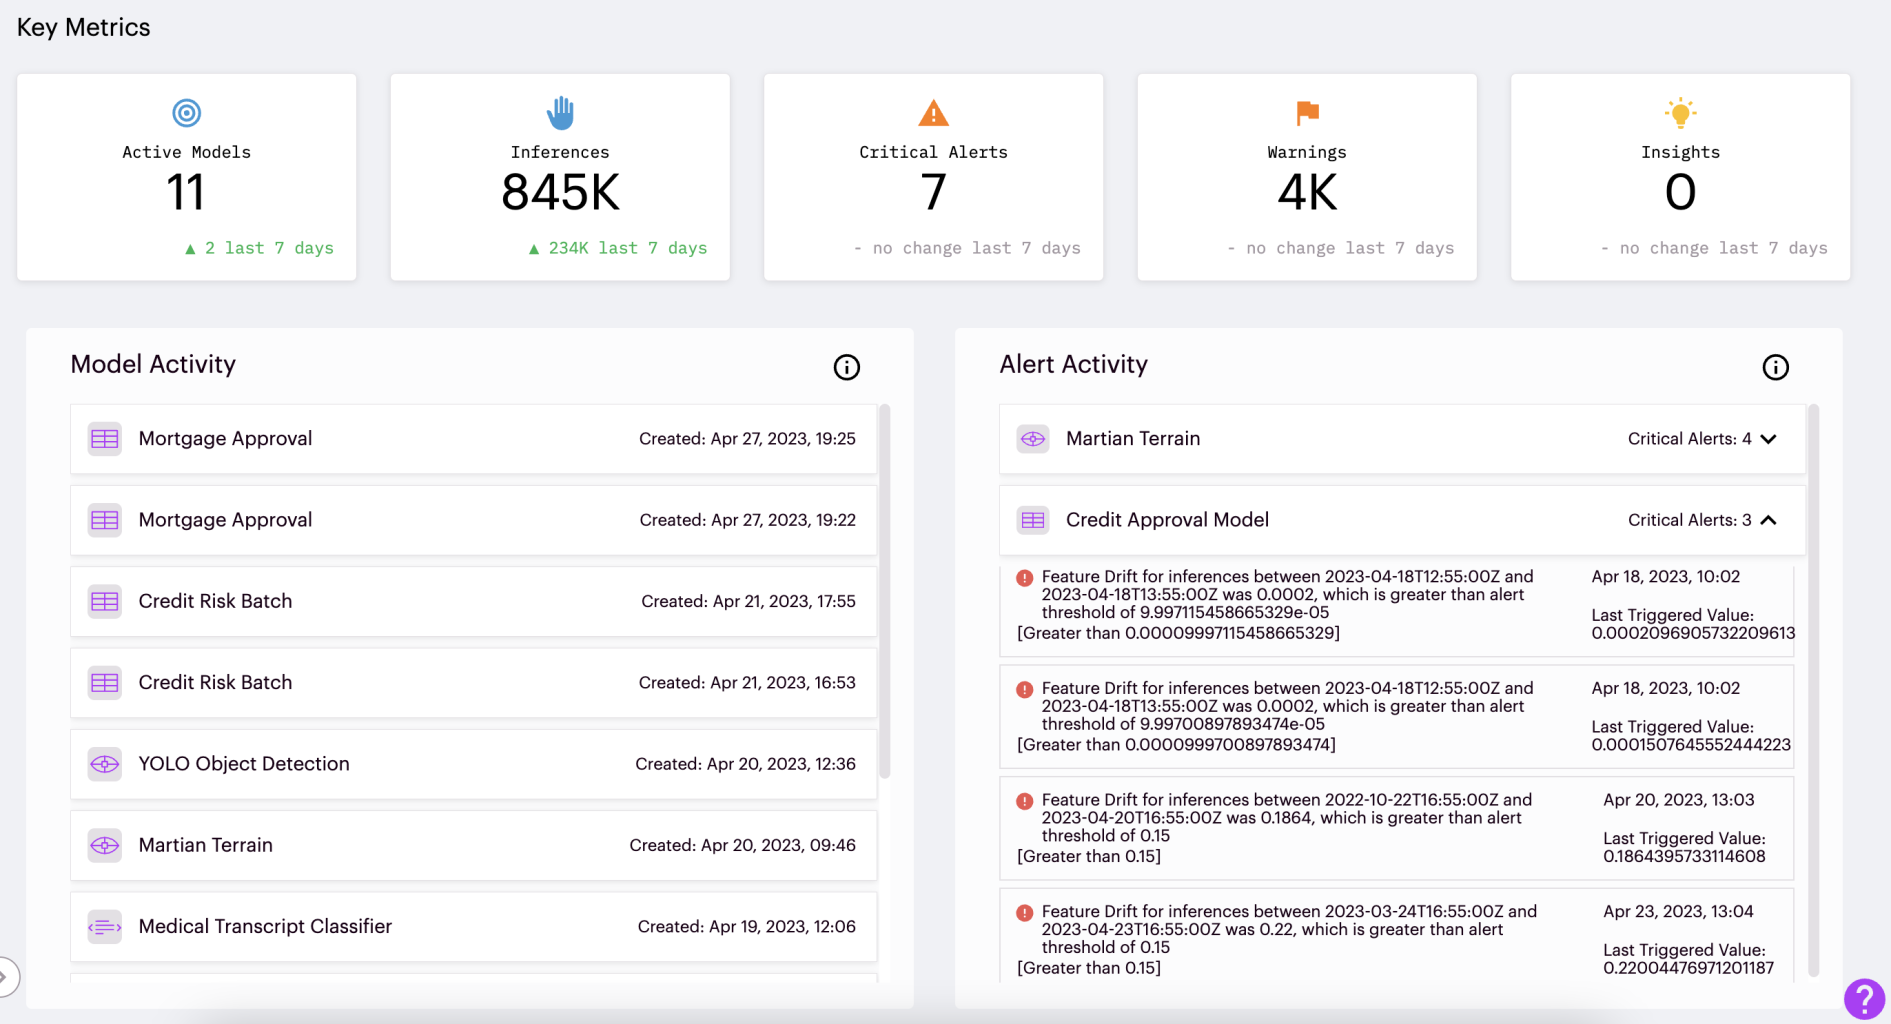
From this page, teams can quickly assess which model's to dive deeper into from a recent alerting perspective.
Alert Management Per Model
There is an Alert tab within each Arthur Model dashboard, as well, that provides a management dashboard for all alerts triggered for that particular model.
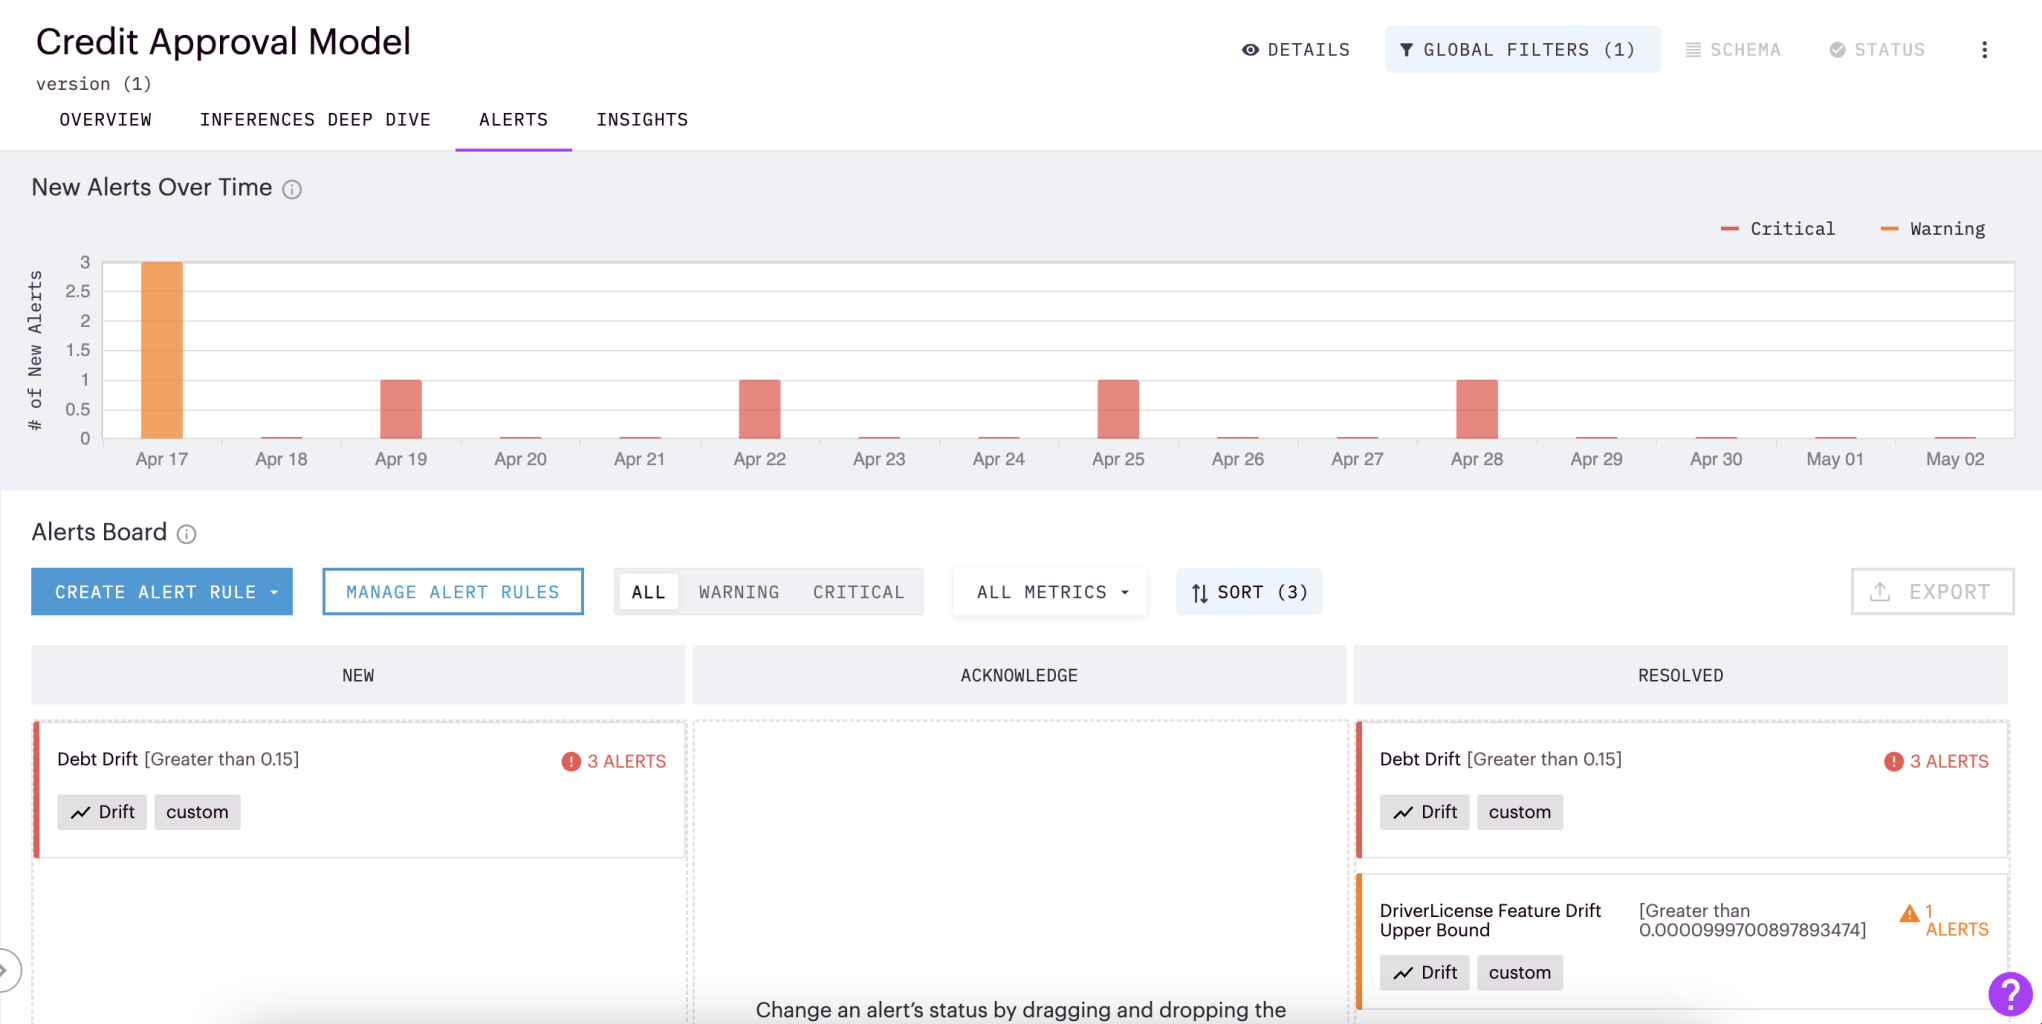
Here teams can:
View Recent History of Alerts: Visualize the recent patterns of alerting over the past two weeks. Understand when new critical alerts or warnings appeared and in what quantity.
Create Alert Rules: Described in the Alerting overview tab. This allows teams to create some of the most common alert rules that we see in an easy, predefined structure.
Filter and Sort Triggered Alerts: Sort alerts by metrics and severity to immediately find the alerts of interest.
Operationalize Alert Management: Teams can tag alerts into different categories through the JIRA board-like structure. While teams can determine the best way to operationalize these categories for these teams, we typically see:
| Category | Use Case Description |
|---|---|
New | New alerts coming into the model that require investigation. |
Acknowledged | Alerts being investigated or looked into by a team member, reducing the repetition of investigation or work within teams. |
Resolved | Alerts that have been investigated and resolved, either through the team triggering retraining, solving an upstream data issue, or even flagging the alert as a false positive and potentially changing the threshold/alert rules |
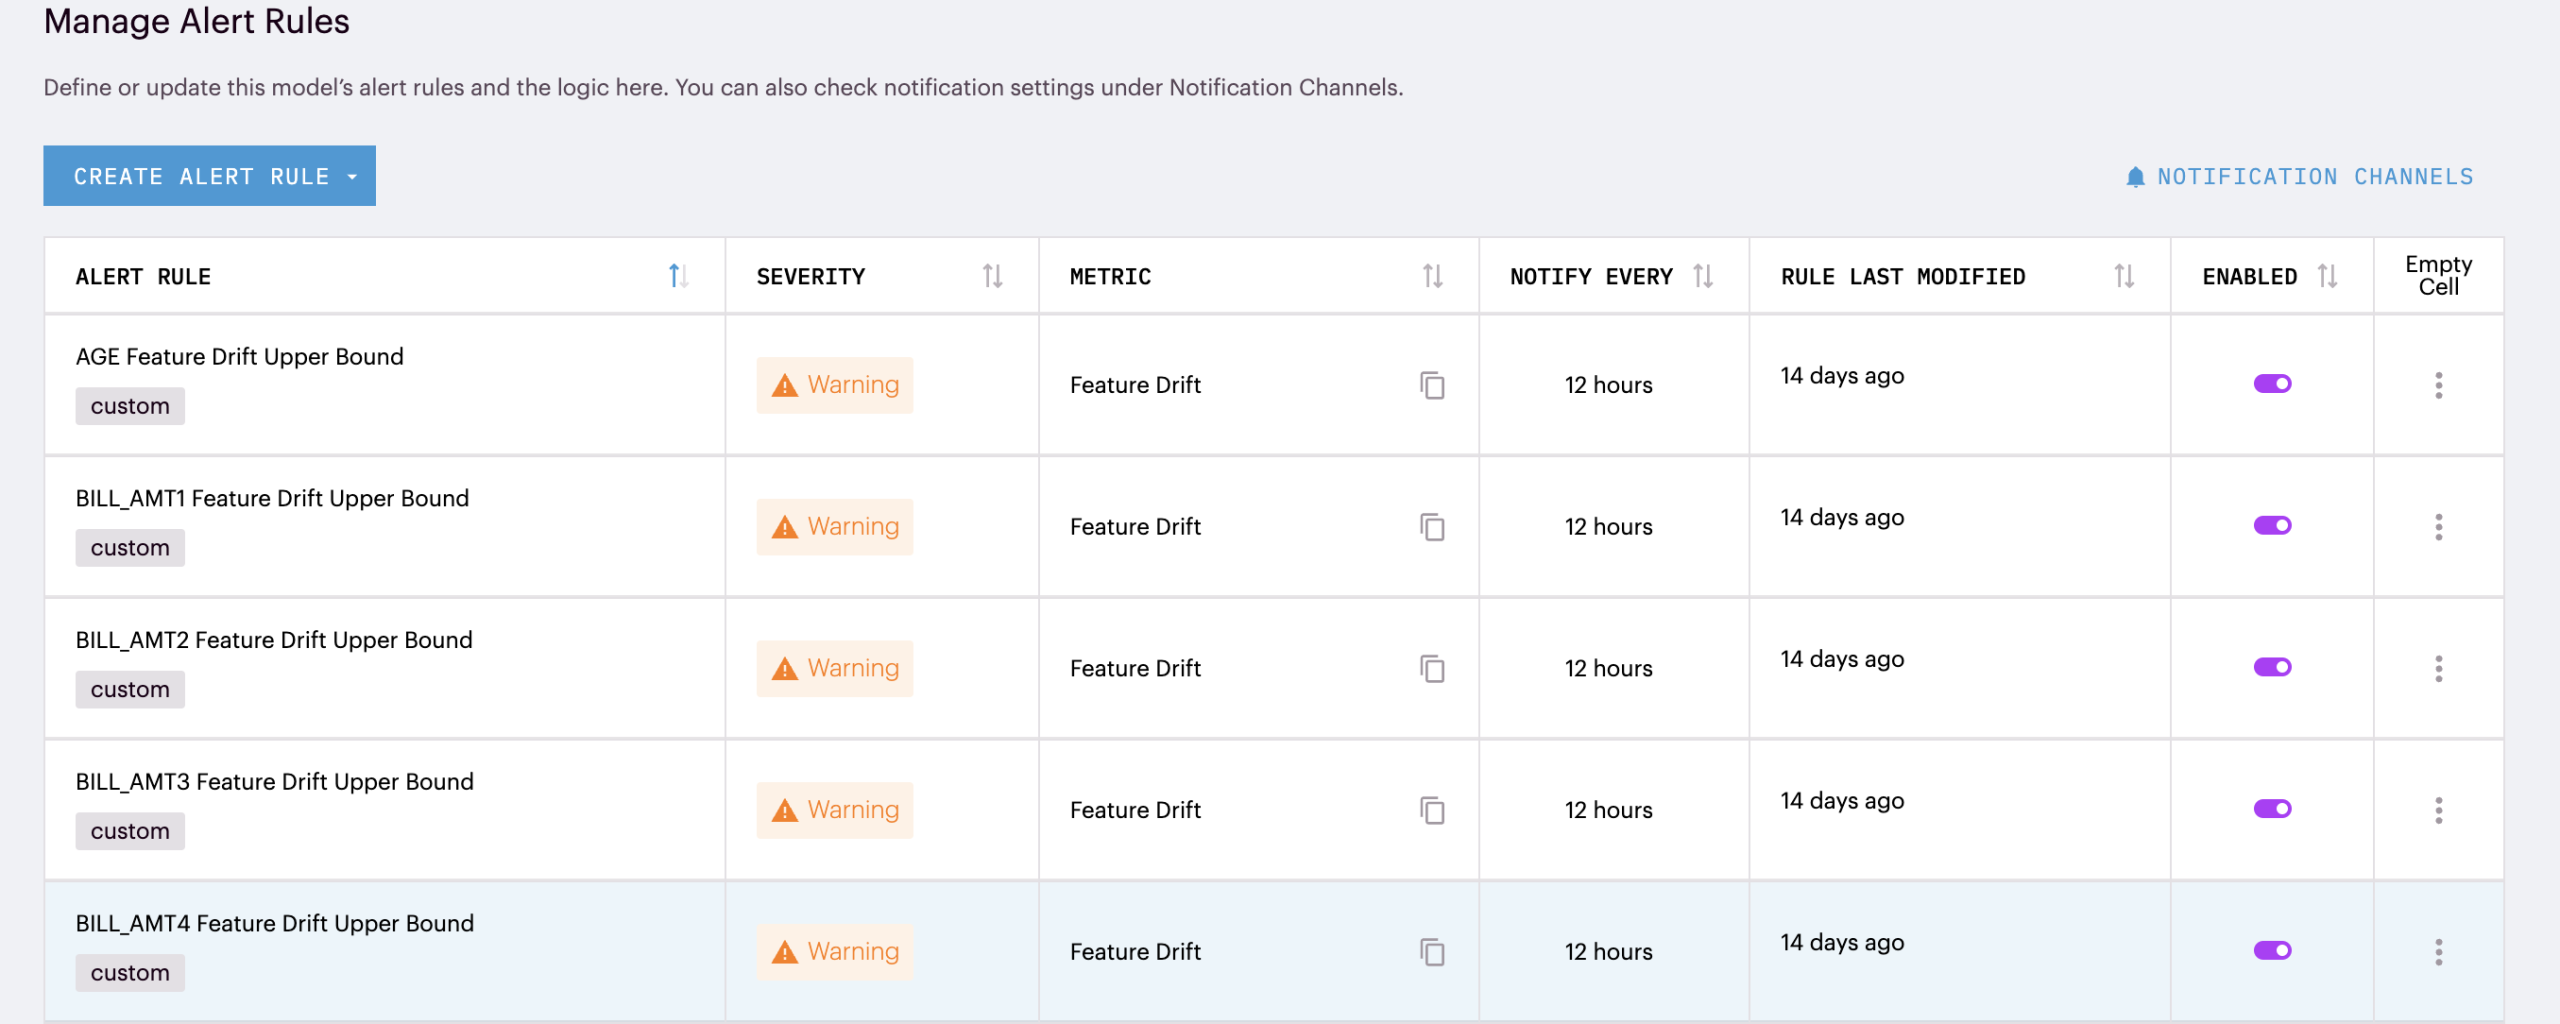
Managing Alert Rules
Within each model's alerting dashboard, teams can view and manage all model alert rules by clicking the Manage Alert Rules button. Understand all alert rules created for your model (enabled or disabled), their severity, and the date they were last updated in one central place.
Investigating a Specific Alert - (Root Cause Analysis)
After clicking on an alert, users are taken to an overview page for the alert. This page describes more about this alert, including a historical list of when it was triggered. It also provides three common analysis charts for the alert to allow teams to begin their root cause analysis into the cause.
These charts include:
- The inference count over time: See how many inferences have been affected in creating this alert
- Alerted metric over time: See how the specific metric of interest
- Alerted metric over time (for the attributes that experienced the most drift): Immediately evaluate if recent data distributional drifts may have been a root cause of the alert
Beyond some initial drilled-down charts for exploration, this alert details tile provides insights
View in Overview: Jump to the Model Overview Tab in the Arthur UI to investigate further. This tab will have global filtered automatically applied to the window of time and/or data segments the alert was triggered on.
Send to Relevant Team-members or stakeholders: You can easily share the alert with others by hitting the send button on the top corner. This alert can be shared by email to anyone who has enabled email alert notifications for this model. Otherwise, users can select Copy Link to copy a link to this alert details tile.
Updated over 1 year ago