
Performance Metrics
Monitor and communicate model performance
Whether a performance alert has been triggered requiring the ML team's attention or an external stakeholder has requested a performance breakdown for a specific segment, Arthur provides a single location to report on and explore model performance across an organization.
Performance Metrics in Arthur
Out-of-the-Box
It can be overwhelming for external stakeholders to balance too many technical definitions for model accuracy, primarily if each team in an organization provides different baseline metrics. Onboarded model schema automatically infers performance metrics of interest for your models, easily standardizing top performance metrics across the organization.
Each model types out-of-the-box performance metrics are defined for them in their Model Types section.
User-Defined Metrics
Different stakeholders define performance differently and accommodate all measures of performance utilizing our ability to curate performance metrics by data slices and user-defined custom metrics.
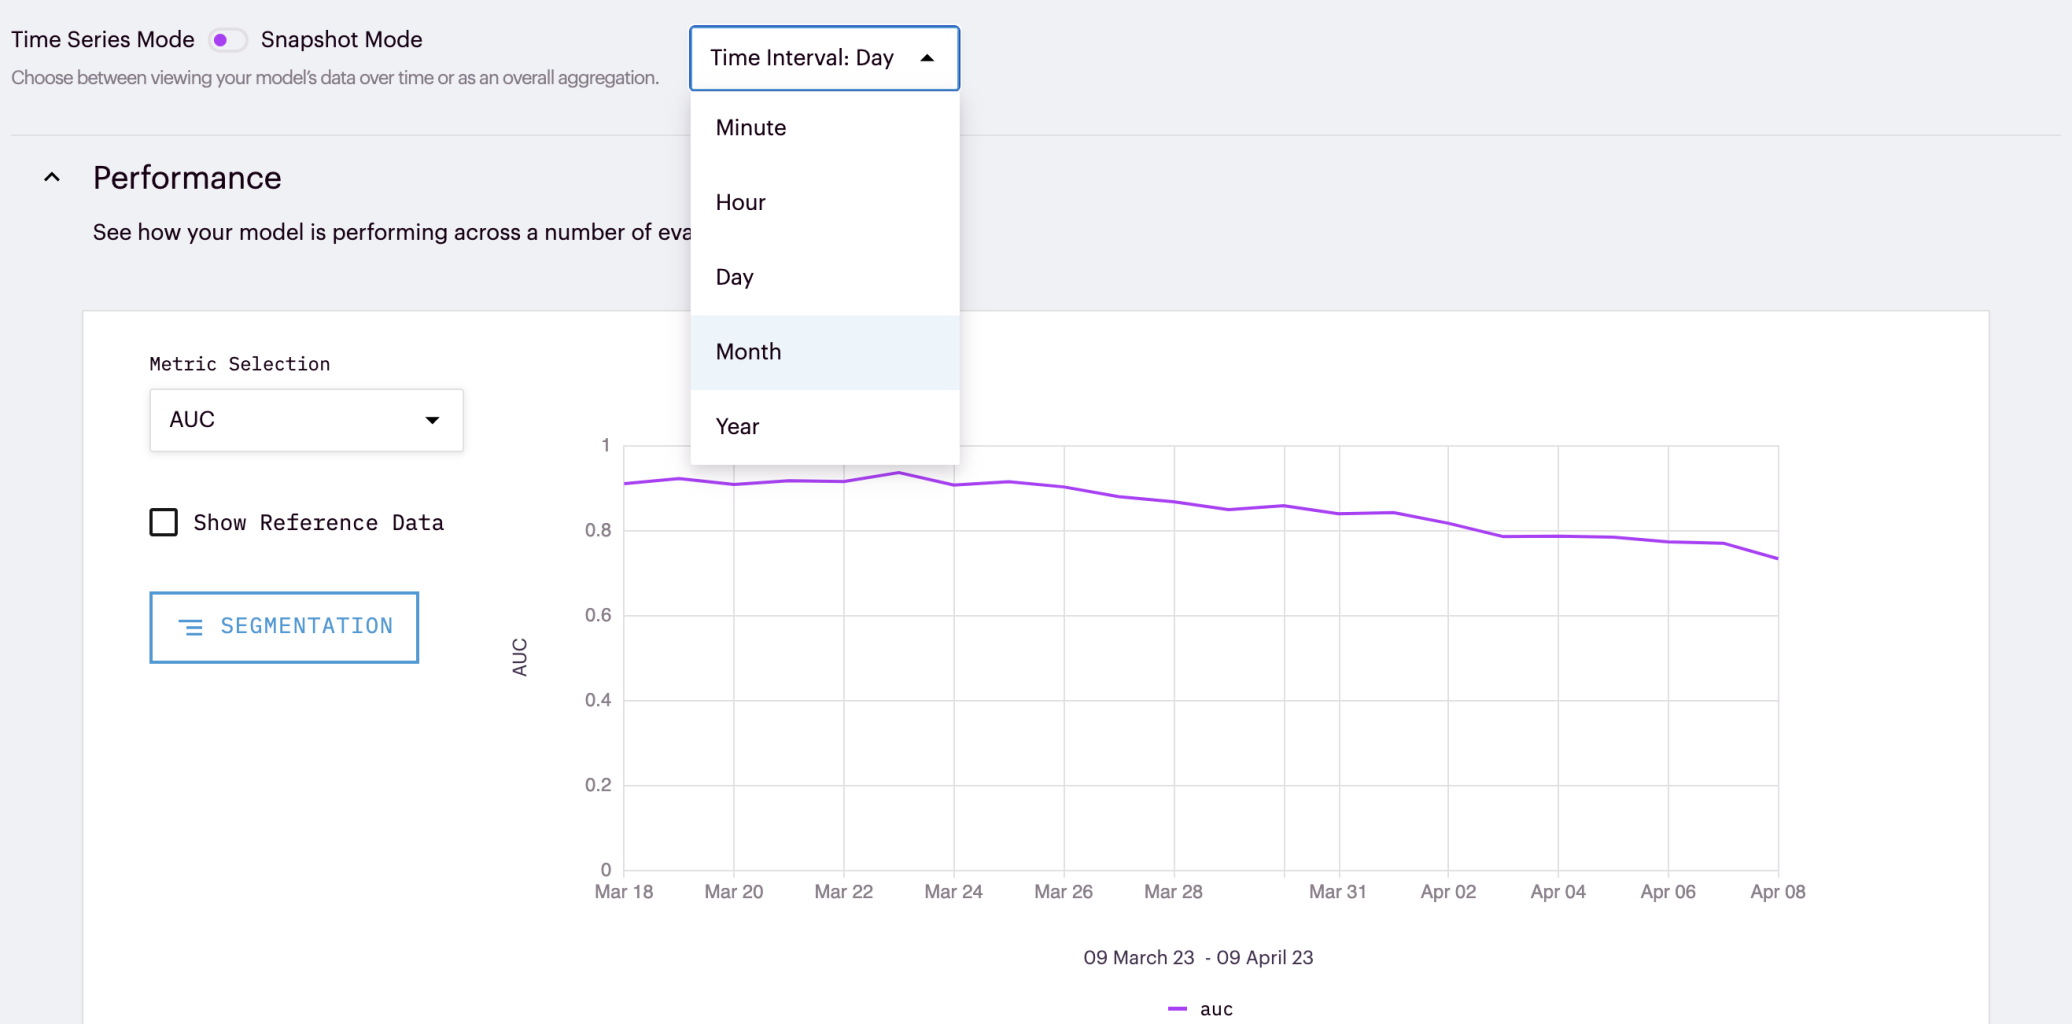
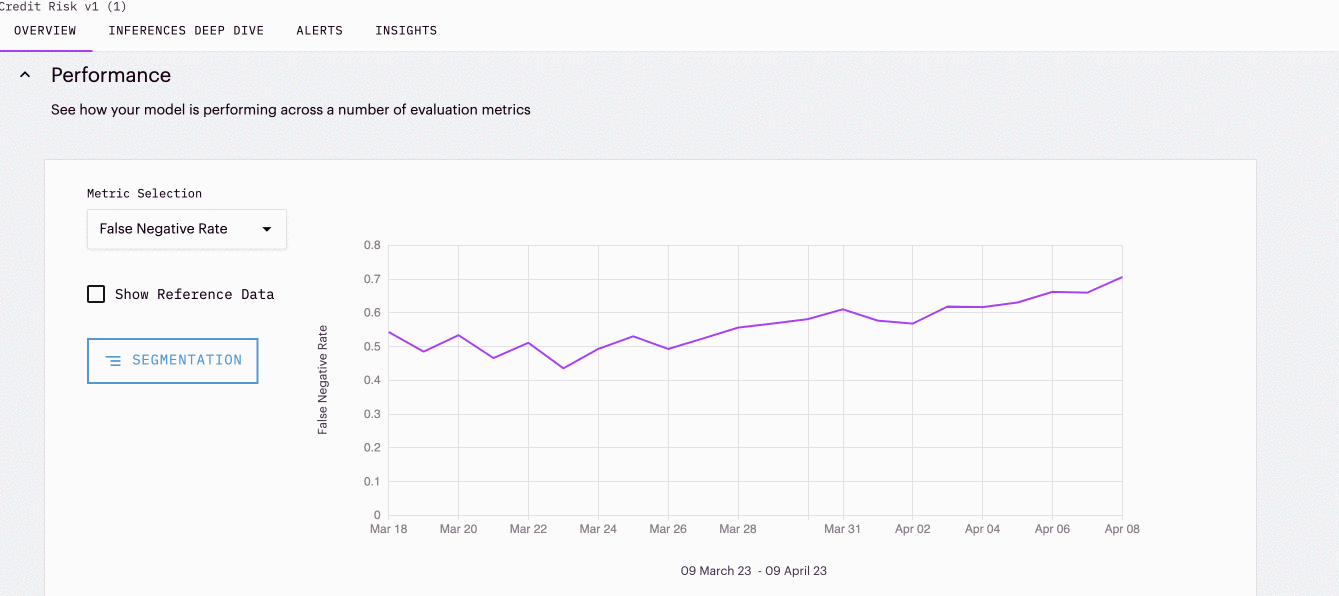
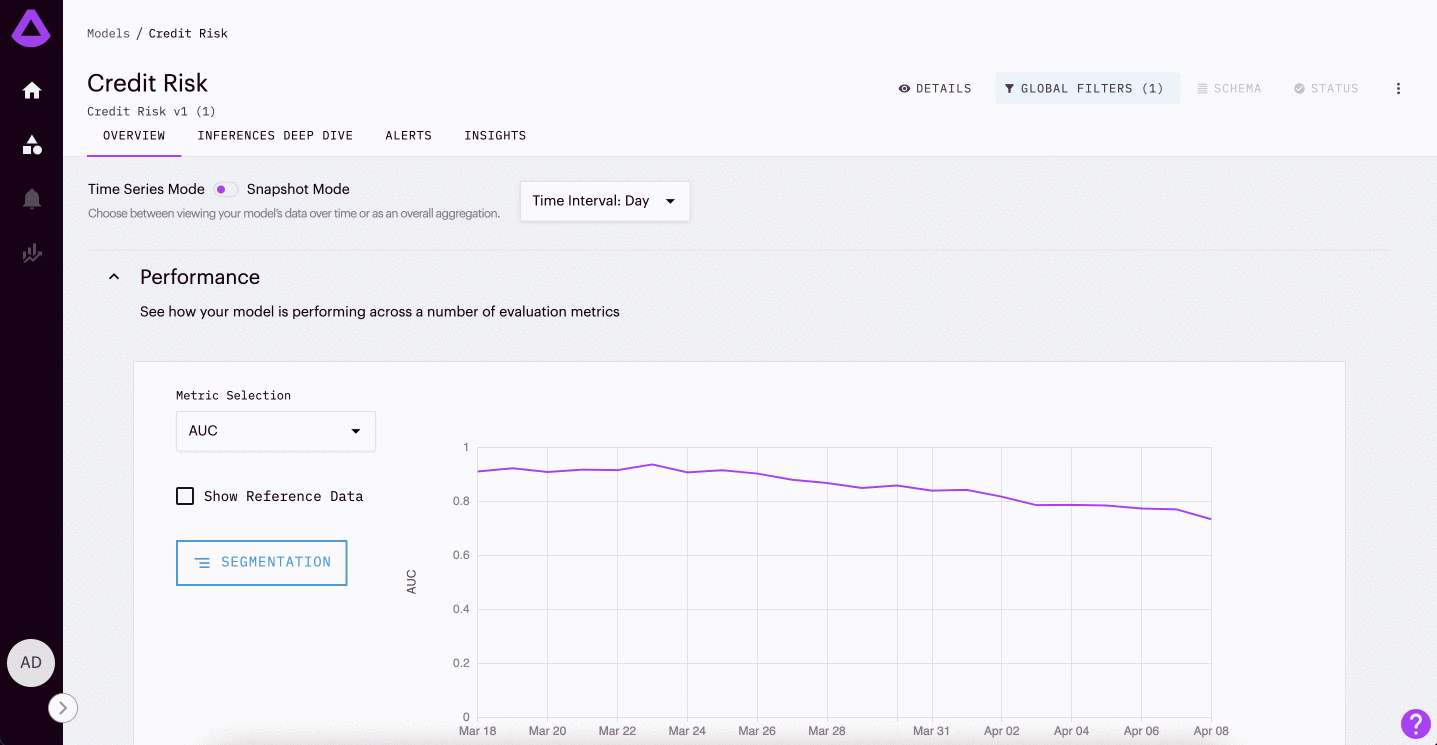
Performance Metric UI Guide
Performance metrics for specific models can be found within that model's Overview tab.
Time Display
The default option for seeing performance charts in the UI is in time series mode. These charts provide an average of each metric overtime at the time interval specified at the top of the chart.
Snapshot Mode
For teams that are not interested in viewing their metrics over time, they can select Snapshot mode in the top corner. This mode creates bar graphs of the average metric over the specified range from the global filters (discussed more below).
Segment Sections of Interest
As referenced above, users can also segment data of interest.
Global Filters
Global Filters are available in the top corner of the UI. Teams can apply time or attribute-based filter rules to generate representative charts for those groups.
Note: Global Filter Are Applied Globally. Global filters do not apply just to the Performance graph or Overview Tab. These filters are applied globally across the UI. This means that they can be used to explore the inferences in the inference deep dive for example. However, it is important to remember that the filters are applied before navigating to other tabs.
Require Ground Truth
One key thing to keep in mind is that many performance metrics require ground truth (or labels). Teams that have a lag between prediction and ground truth should look into Drift and Anomaly metrics within Arthur.
Updated over 1 year ago
Set alerts on your performance metrics, or learn more about different metrics within Arthur.