
Model Metric Definitions
Understanding Model Metrics Monitored with Arthur
Performance
Accuracy Rate
Accuracy is the most common metric for classification tasks. Accuracy is the measure of how many predictions were correct out of all the predictions made.
Accuracy Rate = (# correct predictions) / (total # predictions)
We can also think of accuracy in terms of common confusion matrix rates
Accuracy Rate = (TP + TN) / (TP + TN + FP + FN)
AUC
The Area Under the Curve (AUC) is a metric that measures the performance of a classification model by calculating the area under the receiver operating characteristic (ROC) curve. It provides a single score that summarizes the trade-off between the true positive rate and false positive rate across different thresholds for defining positive cases.
Average Prediction
This is a metric used by regression models. It returns the average prediction your model has output over the
Average Token Likelihood
The token likelihood is a number between 0 and 1 that quantifies the model’s level of surprise that this token was the next predicted token of the sentence. In token sequence models, this metric quantifies the average
In Arthur, this metric is available for token sequence models.
Average Sequence Length
This metric is available for token sequence models. This is the average count of tokens for each inference ingested by Arthur.
Balanced Accuracy Rate
The balanced accuracy rate is a metric used for classification tasks.
Balanced Accuracy Rate = (Sensitivity + Specificity) / 2
Confusion Matrix Rates
A confusion matrix is a table that summarizes the performance of a classification model by comparing its predicted outputs to the true outputs across different classes. It contains information about the number of true positives, true negatives, false positives, and false negatives, which can be used to calculate various metrics for evaluating model performance.
False Negative Rate
The false negative rate is a metric that measures the proportion of actual positive cases that are incorrectly predicted as negative by a classification model. A high false negative rate indicates that the model is missing a significant number of positive cases, which can have serious consequences in some applications.
False Positive Rate
The false positive rate is a metric that measures the proportion of negative cases that are incorrectly predicted as positive by a classification model. A high false positive rate indicates that the model is producing a large number of false alarms, which can be costly or lead to unnecessary actions in some applications.
True Negative Rate
The true negative rate, also known as specificity, is a metric that measures the proportion of actual negative cases that are correctly identified as negative by a classification model. A high true negative rate indicates that the model is able to effectively identify negative cases, which is important in applications where avoiding false positives is critical.
True Positive Rate
The true positive rate, also known as sensitivity or recall, is a metric that measures the proportion of actual positive cases that are correctly identified as positive by a classification model. A high true positive rate indicates that the model is able to effectively identify positive cases, which is especially important in applications where detecting all positive cases is critical.
F1
The F1 score is a single metric that combines precision and recall, two performance metrics used in classification tasks. It ranges from 0 to 1, with higher values indicating better model performance in balancing precision and recall.
F1 = (precision * recall) / (precision + recall)
F1 = TP / (TP + 0.5 * (FP + FN))
Likelihood Stability
This metric is available for token sequence models.
Mean Average Error (MAE)
Mean Absolute Error (MAE) is a metric that measures the average magnitude of the differences between the predicted and actual values of a numerical variable in a regression model. It is calculated as the average absolute difference between the predicted and actual values and is one of the most popular measures of the model's predictive accuracy.
Mean Average Precision
In object detection, Mean Average Precision (MAP) is a commonly used metric that measures the precision and recall of a model in detecting objects of different classes in an image. It takes into account the localization accuracy of the predicted bounding boxes and is often used to compare the performance of different object detection models.
Recall
Recall, also known as sensitivity or true positive rate, is a metric that measures the proportion of true positive cases among all actual positive cases in a classification model. It provides information about the model's ability to detect positive cases and is especially important in applications where detecting all positive cases is critical.
RSME
The Root Mean Squared Error (RMSE) is a metric that measures the average magnitude of the differences between the predicted and actual values of a numerical variable in a regression model. It is calculated as the square root of the average squared difference between the predicted and actual values and is often used as a measure of the model's predictive accuracy.
R Squared
R-squared, also known as the coefficient of determination, is a statistical metric that measures the proportion of variation in the dependent variable that is explained by the independent variable(s) in a regression model. It ranges from 0 to 1, with higher values indicating a better model fit to the data.
Inference Count
Available for all model types. This is the number of predictions that have been sent to Arthur.
Inference Count = # of predictions
Inference Count by Class
For classification models, this metric counts the number of predictions ingested by Arthur per each class label.
Overall Accuracy Rate
The overall accuracy rate is a metric that measures the proportion of correctly classified cases in a classification model, across all classes. It provides a general sense of how well the model is performing, but it may not capture the performance of individual classes or the cost of misclassification errors.
Precision
Precision is a metric that measures the proportion of true positive cases among all predicted positive cases in a classification model. It provides information about the model's ability to minimize false positives and is especially important in applications where avoiding false positives is critical.
Precision = TP / (TP + FP)
Data Drift
Background
We establish some mathematical housekeeping for the below metrics. Let P be the reference distribution and Q be the target distribution. Binning the underlying reference and target sets can approximate these probability distributions. Generally, P is an older dataset, and Q is a new dataset of interest. We'd like to quantify how far the distributions differ to see if the reference set has gone stale, and algorithms trained on it should not be used to perform inferences on the target dataset.
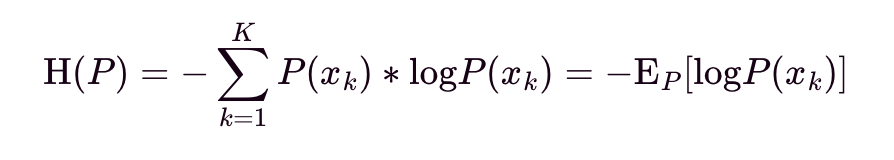
Let H(P) be the entropy of distribution P. It is interpreted as the expected (i.e., average) number of bits (if log base 2) or nats (if log base e) required to encode information of a datapoint from the distribution P. Arthur applications use log base e, so interpretation will be in nats.
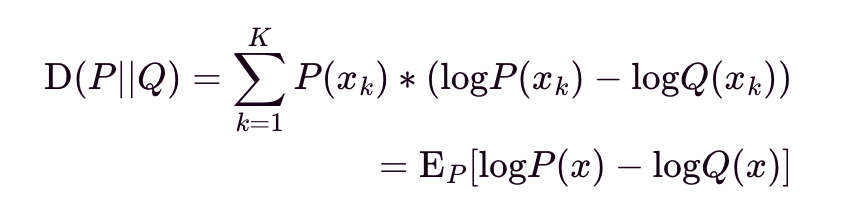
Let D(P||Q) be the Kullback-Leibler (KL) Divergence from P to Q. It is interpreted as the nats of information we expect to lose using Q instead of P for modeling data X, discretized over probability space K. KL Divergence is not symmetrical, i.e., D(P||Q) does not equal D(Q||P) and should not be used as a distance metric.
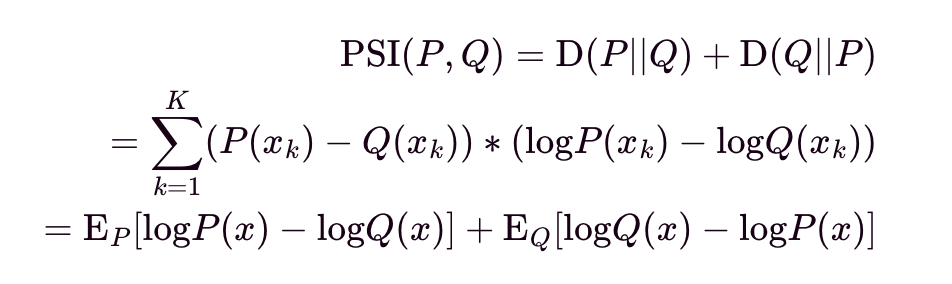
Let PSI(P,Q) be the Population Stability Index (PSI) between P and Q. It is interpreted as the roundtrip loss of na s of information we expect to lose from P to Q and then from Q returning back to P, and vice versa. PSI smooths out KL Divergence since the return" trip information loss is included, and this metric is popular in financial applications.
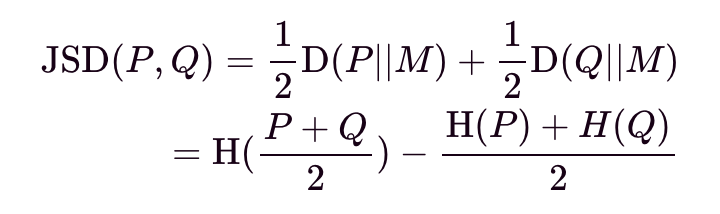
Let JSD(P,Q) be the Jensen-Shannon (JS) Divergence between P and Q. It smooths out KL divergence using a mixture of the base and target distributions and is interpreted as the entropy of the mixture M = (P+Q)_/2 minus the mixture of the entropies of the individual distributions.
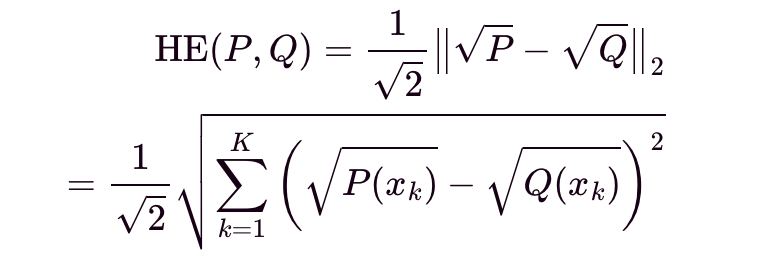
Let HE(P,Q) be the Hellinger Distance between P and Q. It is interpreted as the Euclidean norm of the difference of the square root distributions of P and Q.
Hypothesis Test
Hypothesis testing uses different tests depending on whether a feature is categorical or continuous.
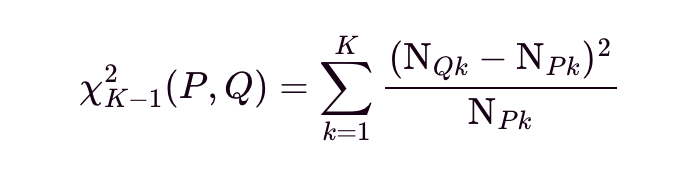
For categorical features, let the equation below be the chi-squared test statistic for P and Q, with K being the number of categories of the feature, i.e., K-1 are the degrees of freedom. Let NPK and NQK be the count of feature occurrences being k, with 1<= k <= K, for P and Q, respectively. The chi-squared test statistic summarizes the standardized differences of expected counts between P and Q.
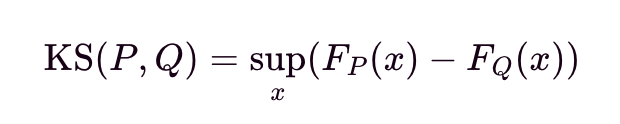
For continuous features, let KS(P, Q) be the Kolmogorov-Smirnov test statistic for P and Q. Let FP and FQ be the empirical cumulative density for P and Q, respectively. The Kolmogorov-Smirnov test is a nonparametric, i.e., distribution-free test that compares the empirical cumulative density functions of P and Q.
The returned test statistic is then compared to cutoffs for significance. A higher test statistic indicates more data drift. We've abstracted the calculations away within our query endpoint.
For HypothesisTest, the returned value is transformed as -log_10(P_value) to maintain directional parity with the other data drift metrics. A lower P_value is more significant and implies data drift, reflected in a higher -log_10(P_value).
Fairness
Demographic Parity
Demographic parity is a fairness metric that measures whether the proportion of positive outcomes is the same across different demographic groups in a classification model. It aims to ensure that the model is not systematically biased towards or against certain groups based on demographic characteristics like race or gender.
Equalized Odds
Equalized Odds is a fairness metric that measures the true positive and false positive rates for a given group, such as a protected group defined by a demographic characteristic like race or gender, in a classification model. It ensures that the model is not systematically biased against certain groups and can help identify and address potential discrimination or unequal treatment issues in both true positive and false positive rates.
Equal Opportunity
Equal Opportunity is a fairness metric that measures the true positive rate for a given group, such as a protected group defined by a demographic characteristic like race or gender, in a classification model. It ensures that the model is not systematically biased against certain groups and can help identify and address potential discrimination or unequal treatment issues.
Updated over 1 year ago