Gini Coefficient (Single-Threshold Metric)
This document provides an example of the metric Gini Coefficient.
Overview
This custom metric computes a daily Gini value at a fixed decision threshold on your prediction column.
It treats rows as being above or below the threshold and measures how mixed those two groups are.
- Lower values (closer to 0) → more pure (most predictions on one side of the threshold).
- Higher values (toward the maximum) → more mixed, i.e., less separation at that threshold.
This is useful when you want a simple, threshold-specific impurity measure that you can track over time alongside other classification metrics.
Step 1: Write the SQL
This SQL:
- Buckets rows into 1-day windows
- Splits predictions using a configurable
thresholdValue - Computes a Gini-style impurity based on the proportion above vs below that threshold
WITH counts AS (
  SELECT
    time_bucket(INTERVAL '1 day', {{timestampColumnName}}) AS ts,
    SUM(
      CASE
        WHEN {{predictionColumnName}} >= {{thresholdValue}} THEN 1
        ELSE 0
      END
    )::float AS pos_count,
    COUNT(*)::float AS total_count
  FROM
    {{dataset}}
  GROUP BY
    1
)
SELECT
  ts,
  CASE
    WHEN total_count > 0 THEN
      1
      - (
          POWER(pos_count / total_count, 2)
          + POWER((total_count - pos_count) / total_count, 2)
        )
    ELSE 0
  END AS gini_coefficient
FROM
  counts
ORDER BY
  ts;
What this query is doing
time_bucket('1 day', {{timestampColumnName}})groups events into daily time buckets and exposes the result asts.- The two
SUM(CASE ...)blocks count:- Rows with
{{predictionColumnName}} >= {{thresholdValue}} - Rows with
{{predictionColumnName}} < {{thresholdValue}}
- Rows with
- Each count is divided by
COUNT(*)to get a proportion. - The expression
1 - (p_high² + p_low²)is the Gini impurity of this two-group split, returned asgini_coefficient.
Step 2: Fill Basic Information
When creating the custom metric in the Arthur UI:
-
Name:
Gini Coefficient -
Description (optional but recommended):
Daily Gini-style impurity at a fixed prediction threshold, based on how many predictions fall above vs below the threshold.
Step 3: Configure the Aggregate Arguments
You will set up four aggregate arguments to parameterize the SQL.
Argument 1 — Timestamp Column
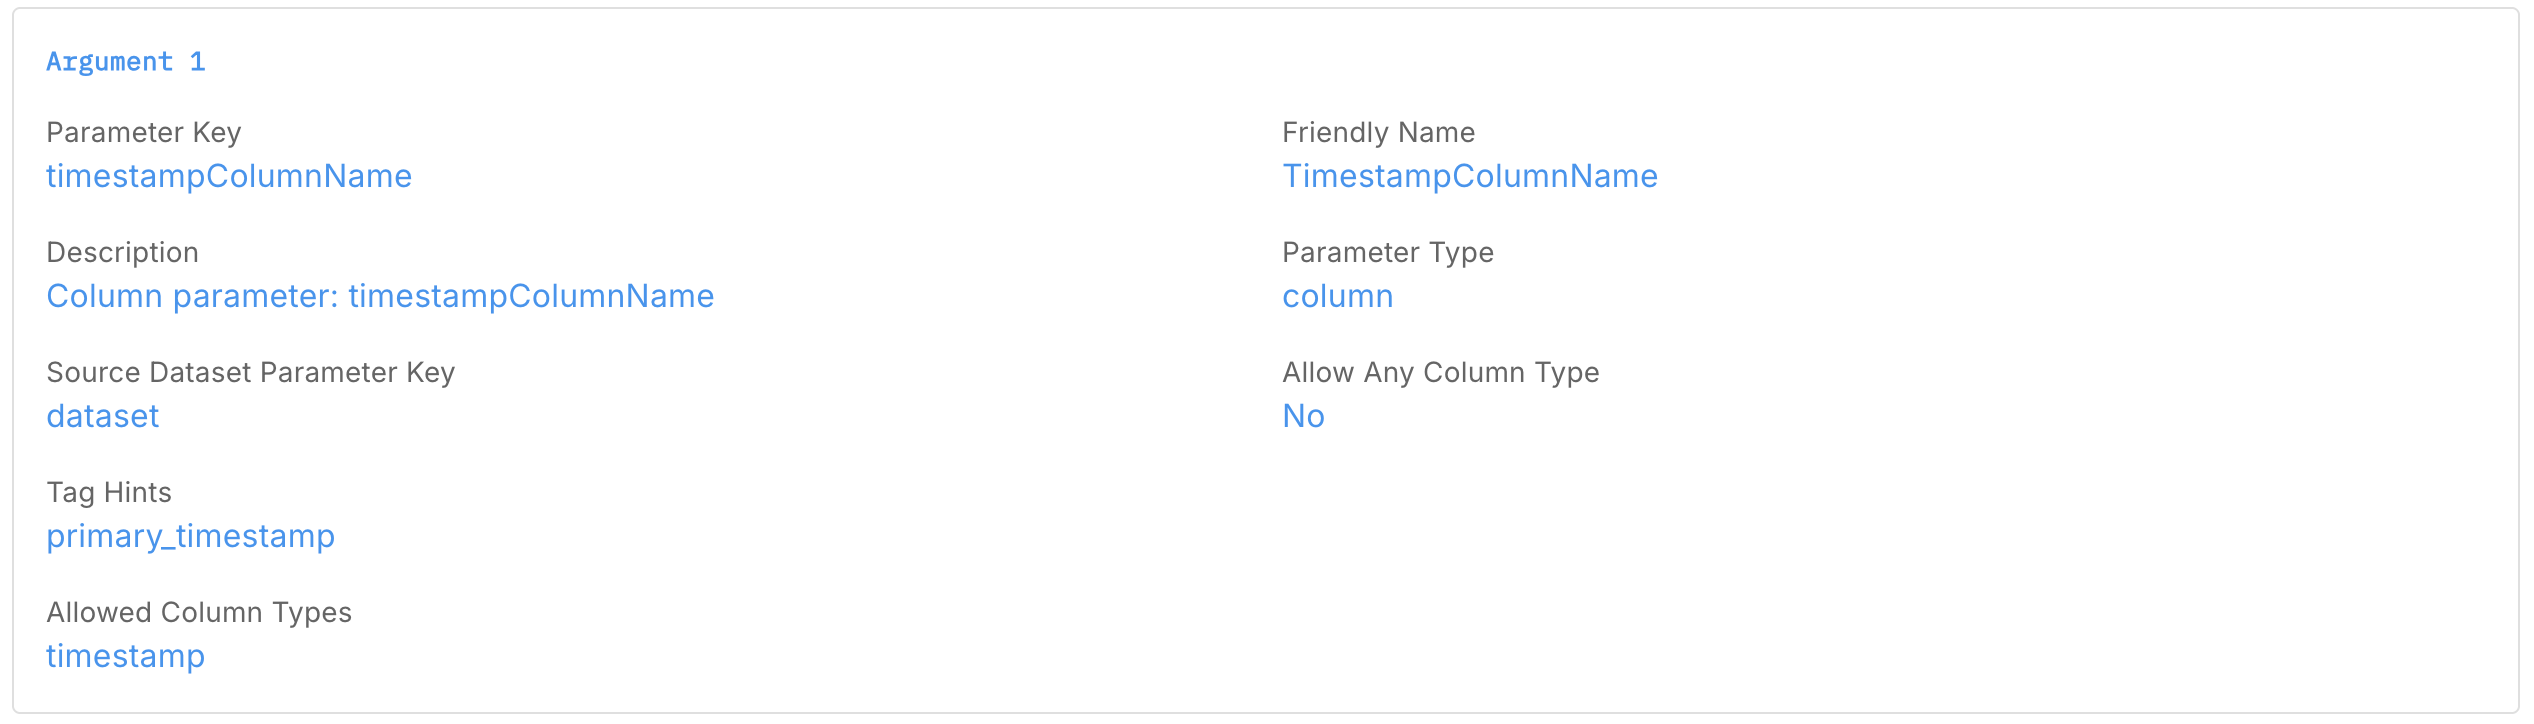
- Parameter Key:
timestampColumnName - Friendly Name:
TimestampColumnName - Description:
Column parameter: timestampColumnName - Parameter Type:
Column - Source Dataset Parameter Key:
Dataset (dataset) - Allow Any Column Type:
No - Tag hints (optional):
primary_timestamp - Allowed Column Types (optional):
timestamp
This tells Arthur which timestamp column to use for the time_bucket function.
Argument 2 — Prediction Column
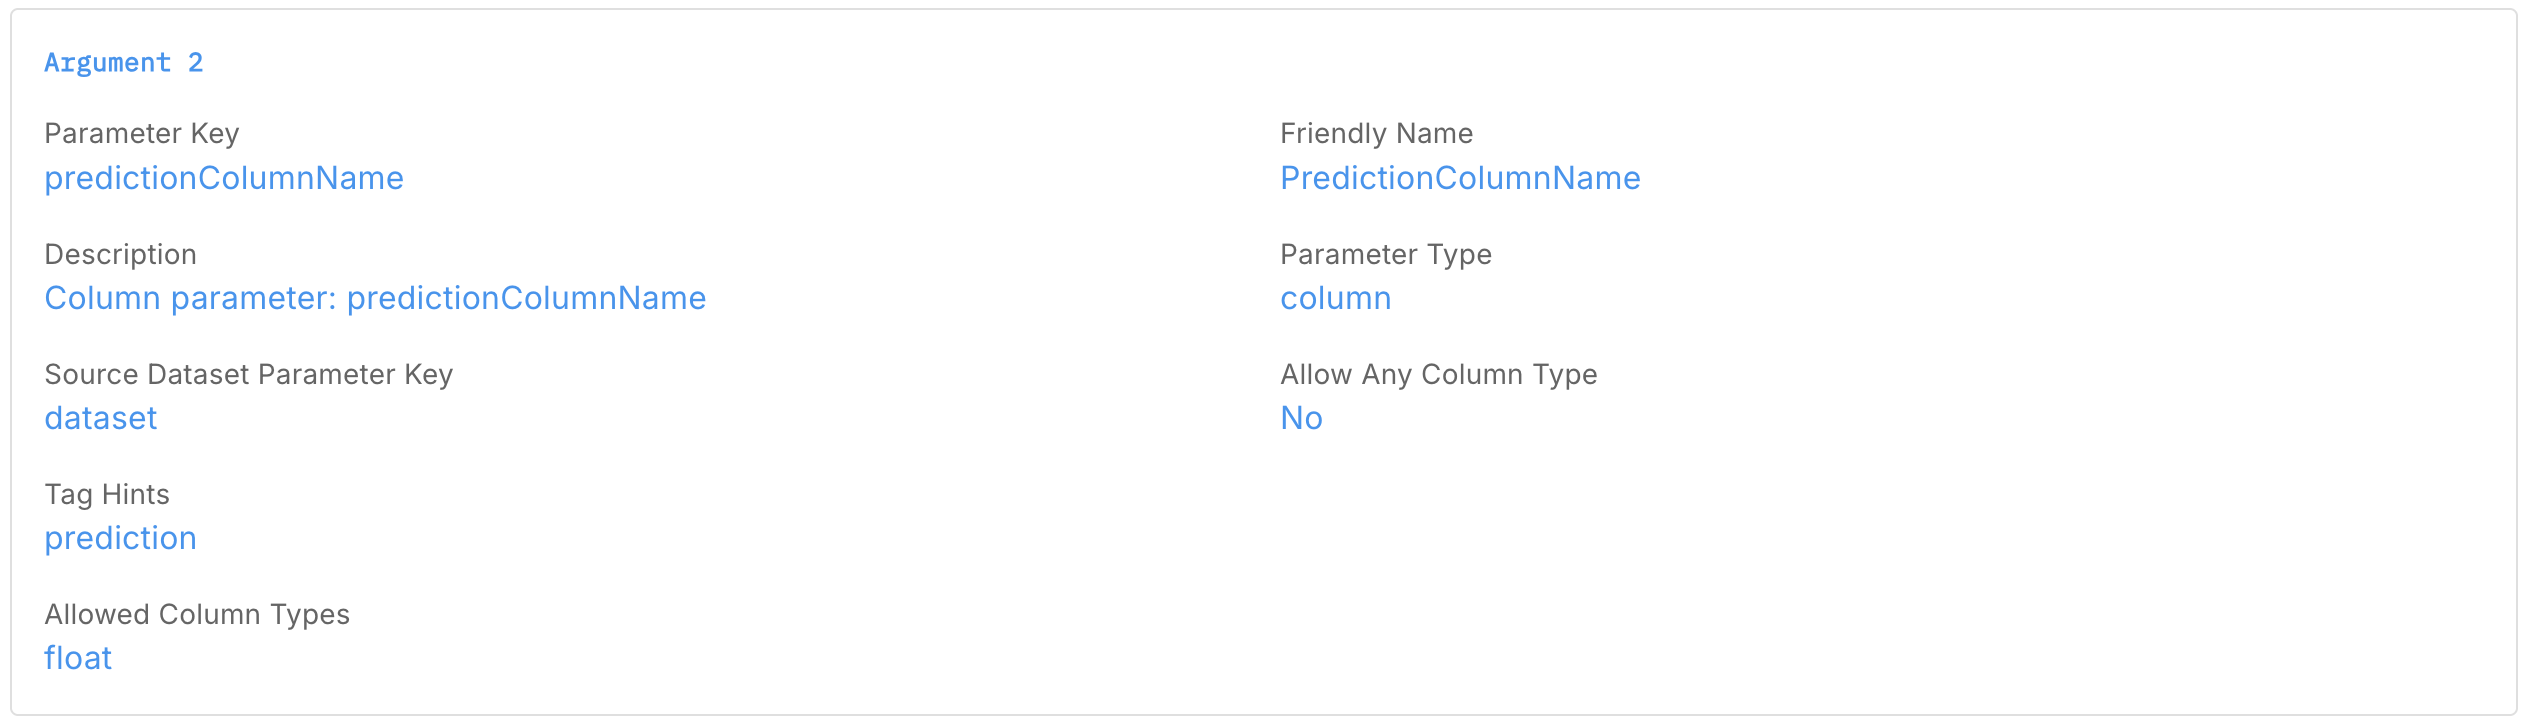
- Parameter Key:
predictionColumnName - Friendly Name:
PredictionColumnName - Description:
Column parameter: predictionColumnName - Parameter Type:
Column - Source Dataset Parameter Key:
Dataset (dataset) - Allow Any Column Type:
No - Tag hints (optional):
prediction - Allowed Column Types (optional):
float
This should point to your model’s prediction or score column (typically a probability for the positive class).
Argument 3 — Threshold Value
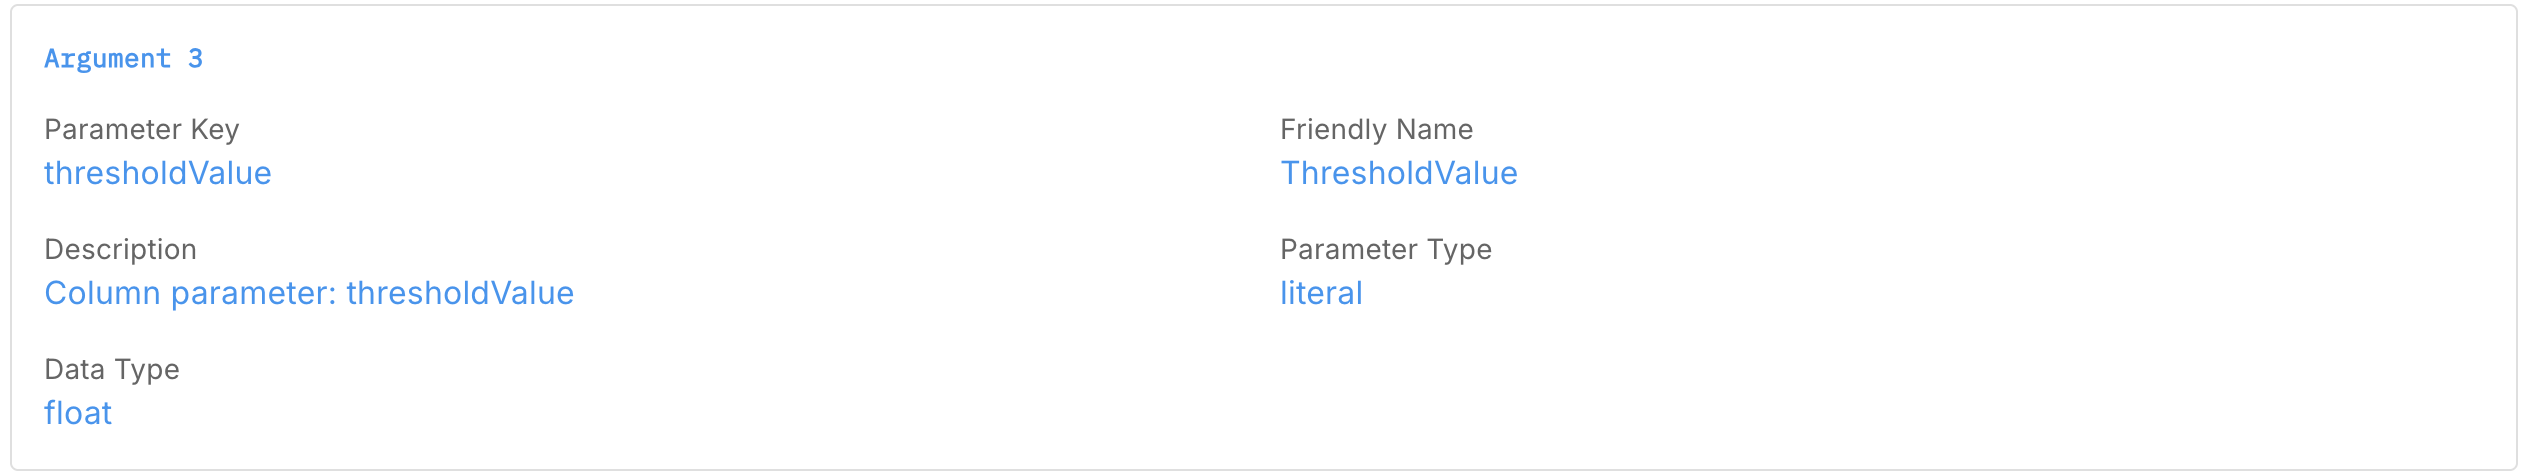
- Parameter Key:
thresholdValue - Friendly Name:
ThresholdValue - Description:
Literal threshold used to split predictions into high vs low groups. - Parameter Type:
Literal - Data Type:
Float
Use this to match your operating threshold (e.g., 0.5) or any other cutpoint you care about. You can later clone this metric with different thresholds if needed.
Argument 4 — Dataset
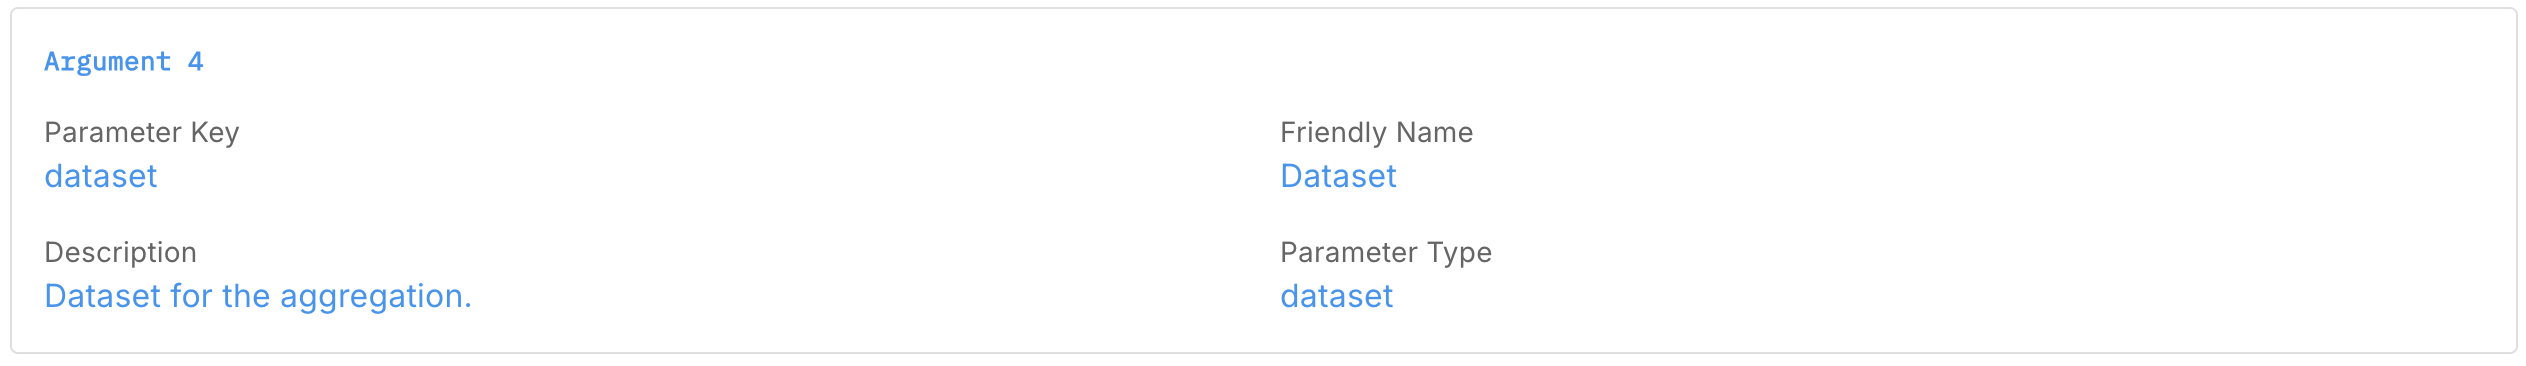
- Parameter Key:
dataset - Friendly Name:
Dataset - Description:
Dataset for the aggregation. - Parameter Type:
Dataset
This links the metric definition to whichever Arthur dataset (inference or batch) you want to compute Gini on.
Step 4: Configure the Reported Metrics
Reported Metric 1 — Gini Coefficient
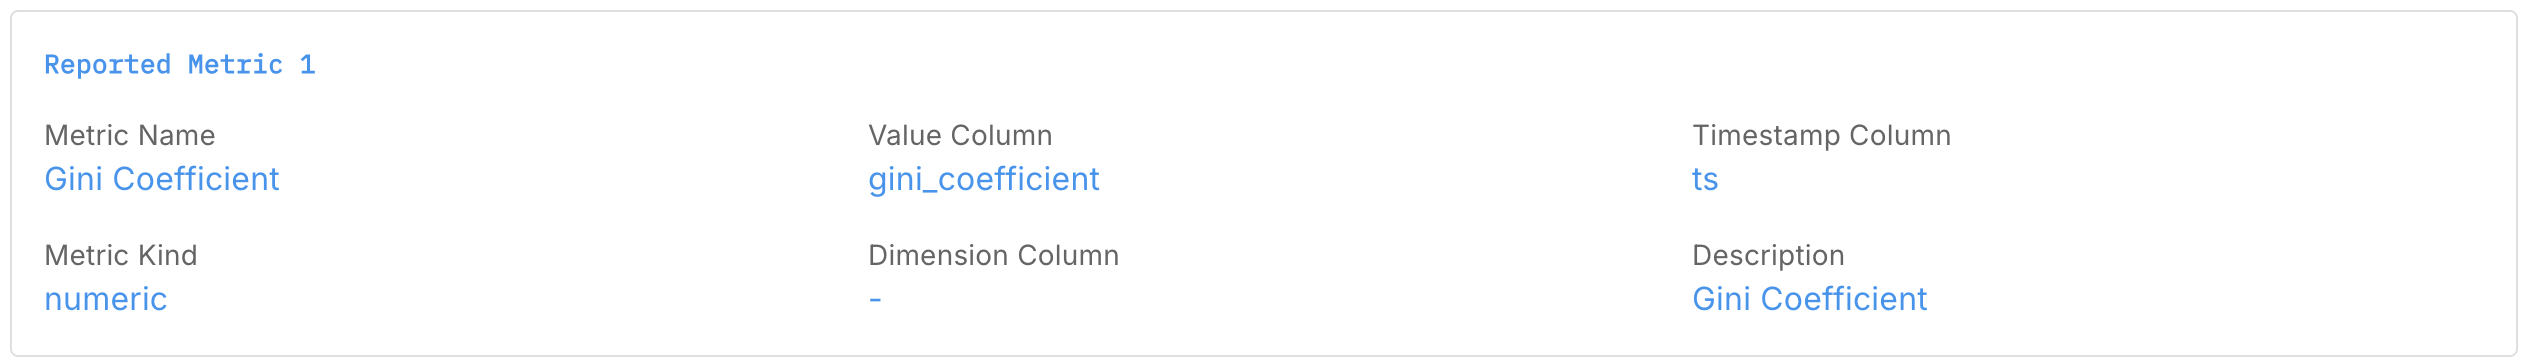
- Metric Name:
Gini Coefficient - Description:
Daily Gini-style impurity of predictions at the configured threshold. - Value Column:
gini_coefficient - Timestamp Column:
ts - Metric Kind:
Numeric
This tells Arthur which column from the SQL result to store as the metric value and which column is the associated timestamp.
Interpreting the Gini Coefficient
- Low values (close to 0)
- Most predictions are concentrated on one side of the threshold.
- The split is “pure”: the threshold is separating your dataset into a dominant group and a small minority.
- Higher values
- Predictions are more evenly split above vs below the threshold.
- The threshold is less discriminative in terms of how it partitions the population.
You can:
- Plot this metric over time to see whether the sharpness of your decision boundary is changing.
- Use multiple versions (different
thresholdValues) to compare how different thresholds behave operationally.
Preview Data
for startDate use 2025-11-26T17:54:05.425Z
for endDate use 2025-12-10T17:54:05.425Z
Updated 6 months ago