Traces
This section describes how to view you traces.
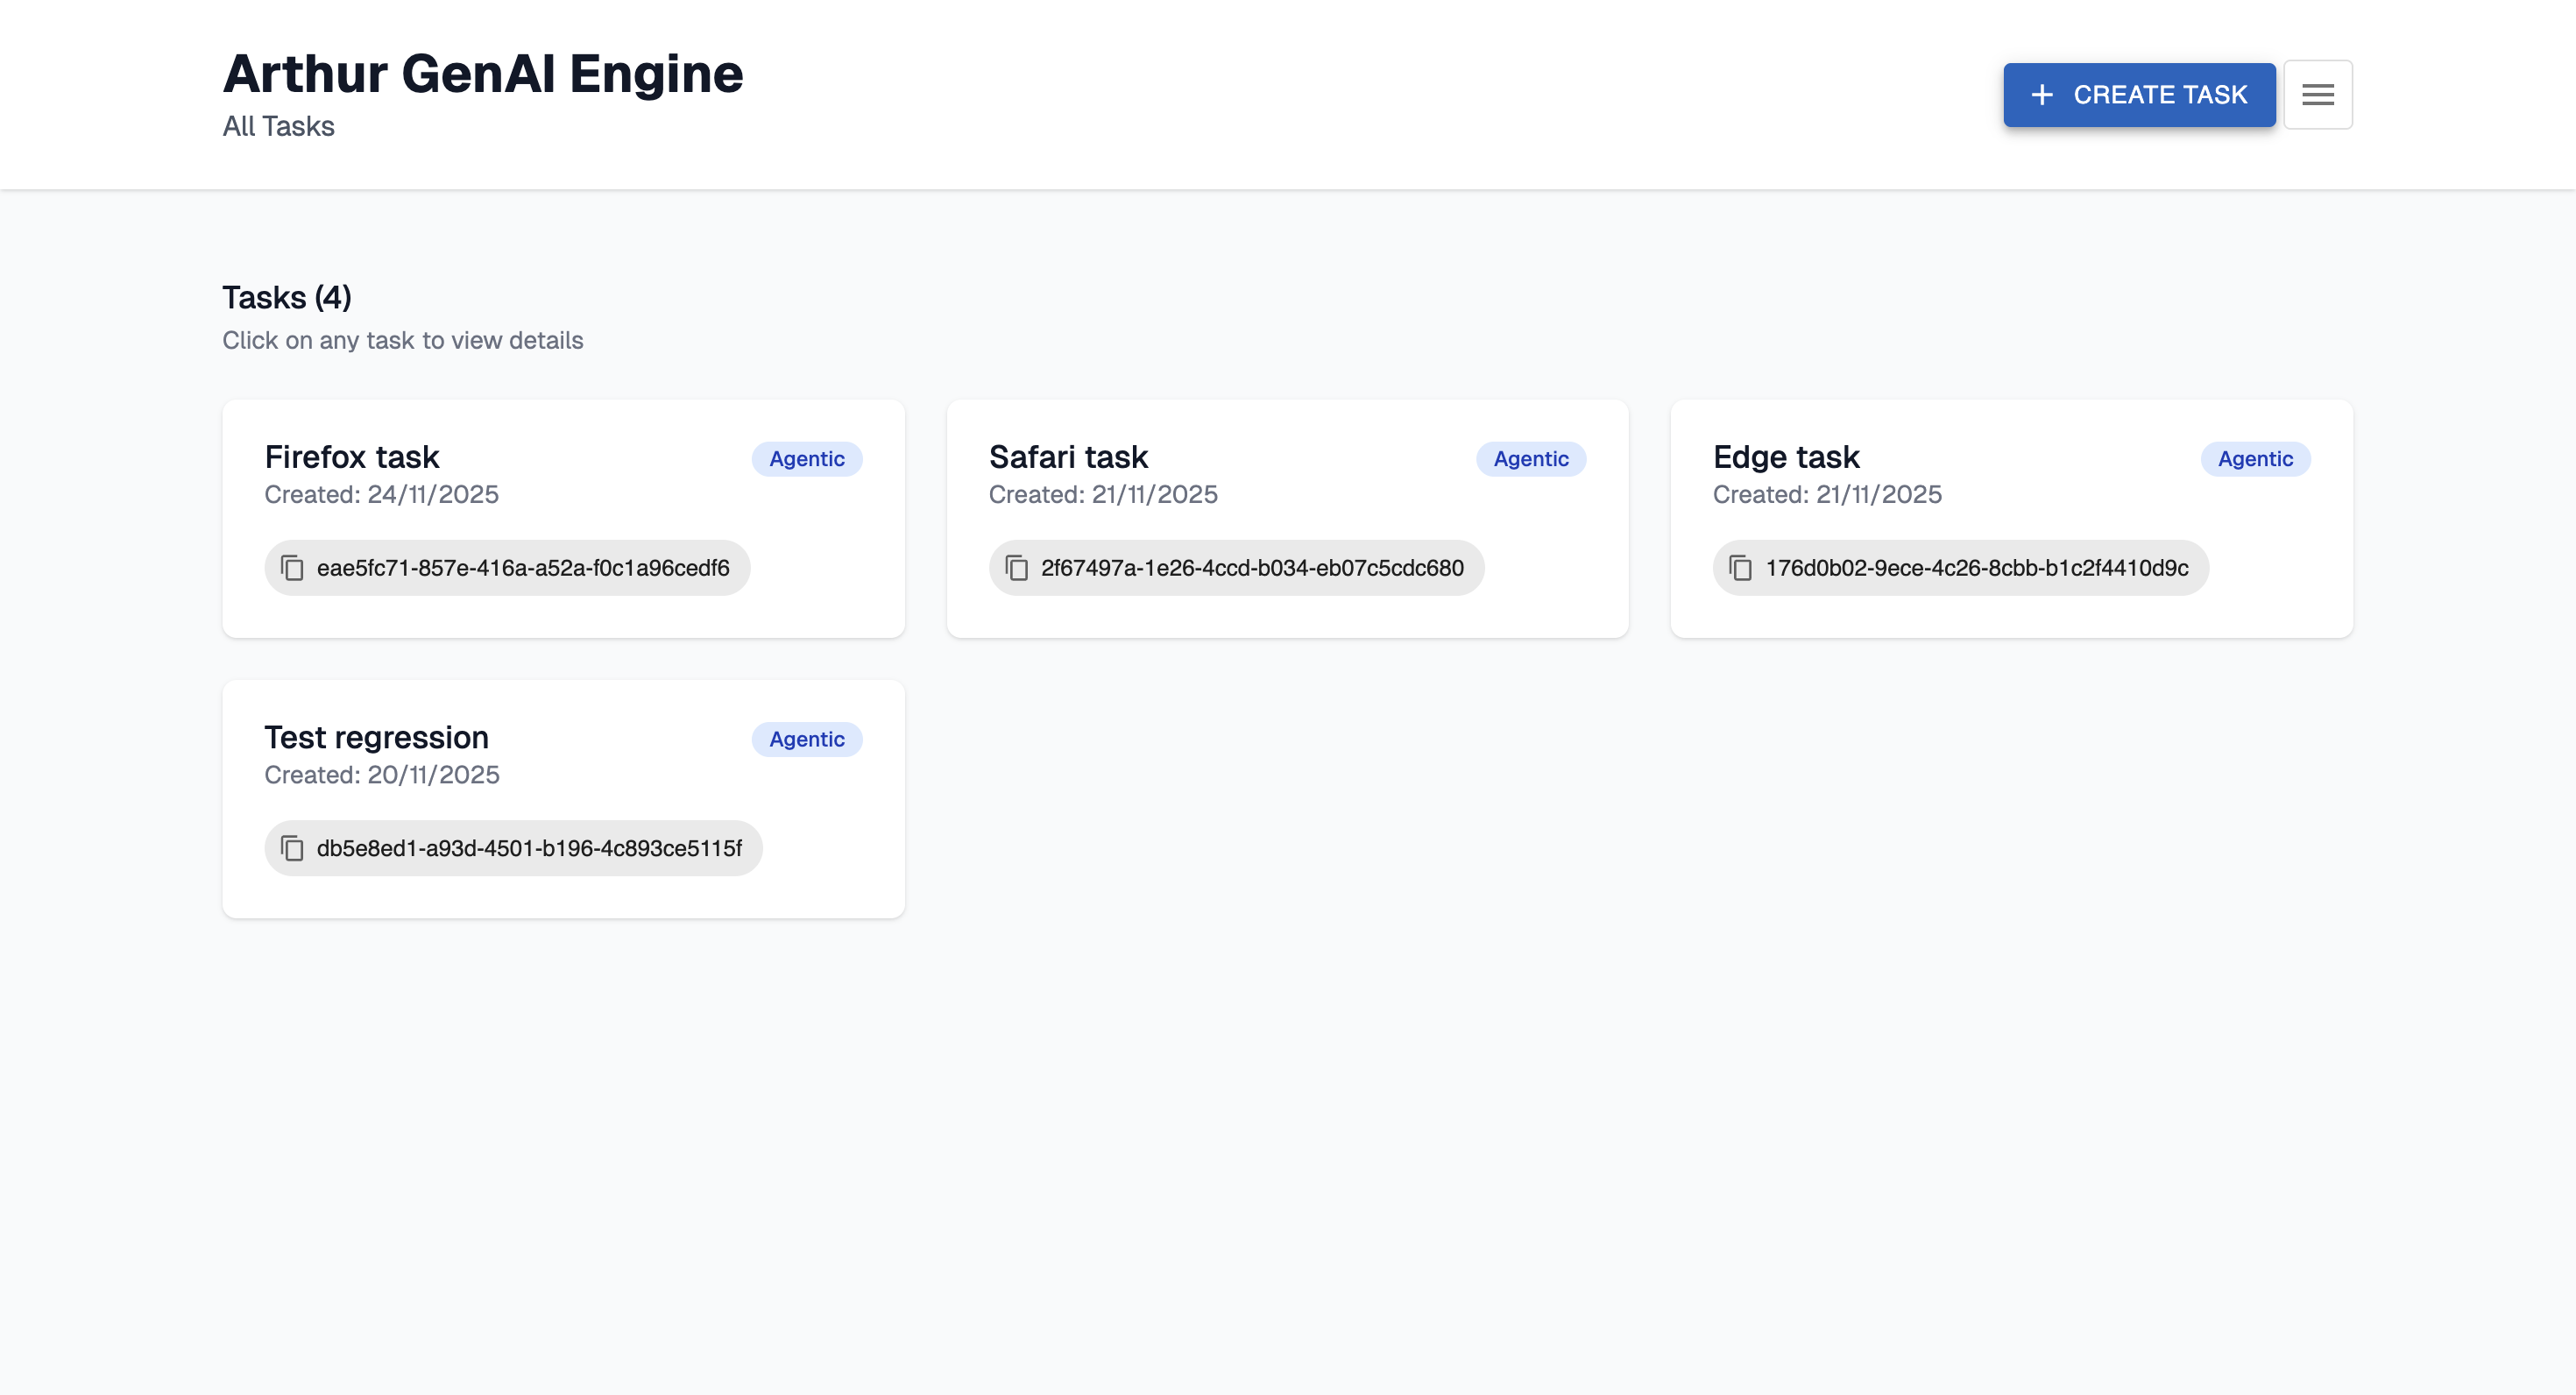
Navigate to http://localhost:3030/ and select the task.
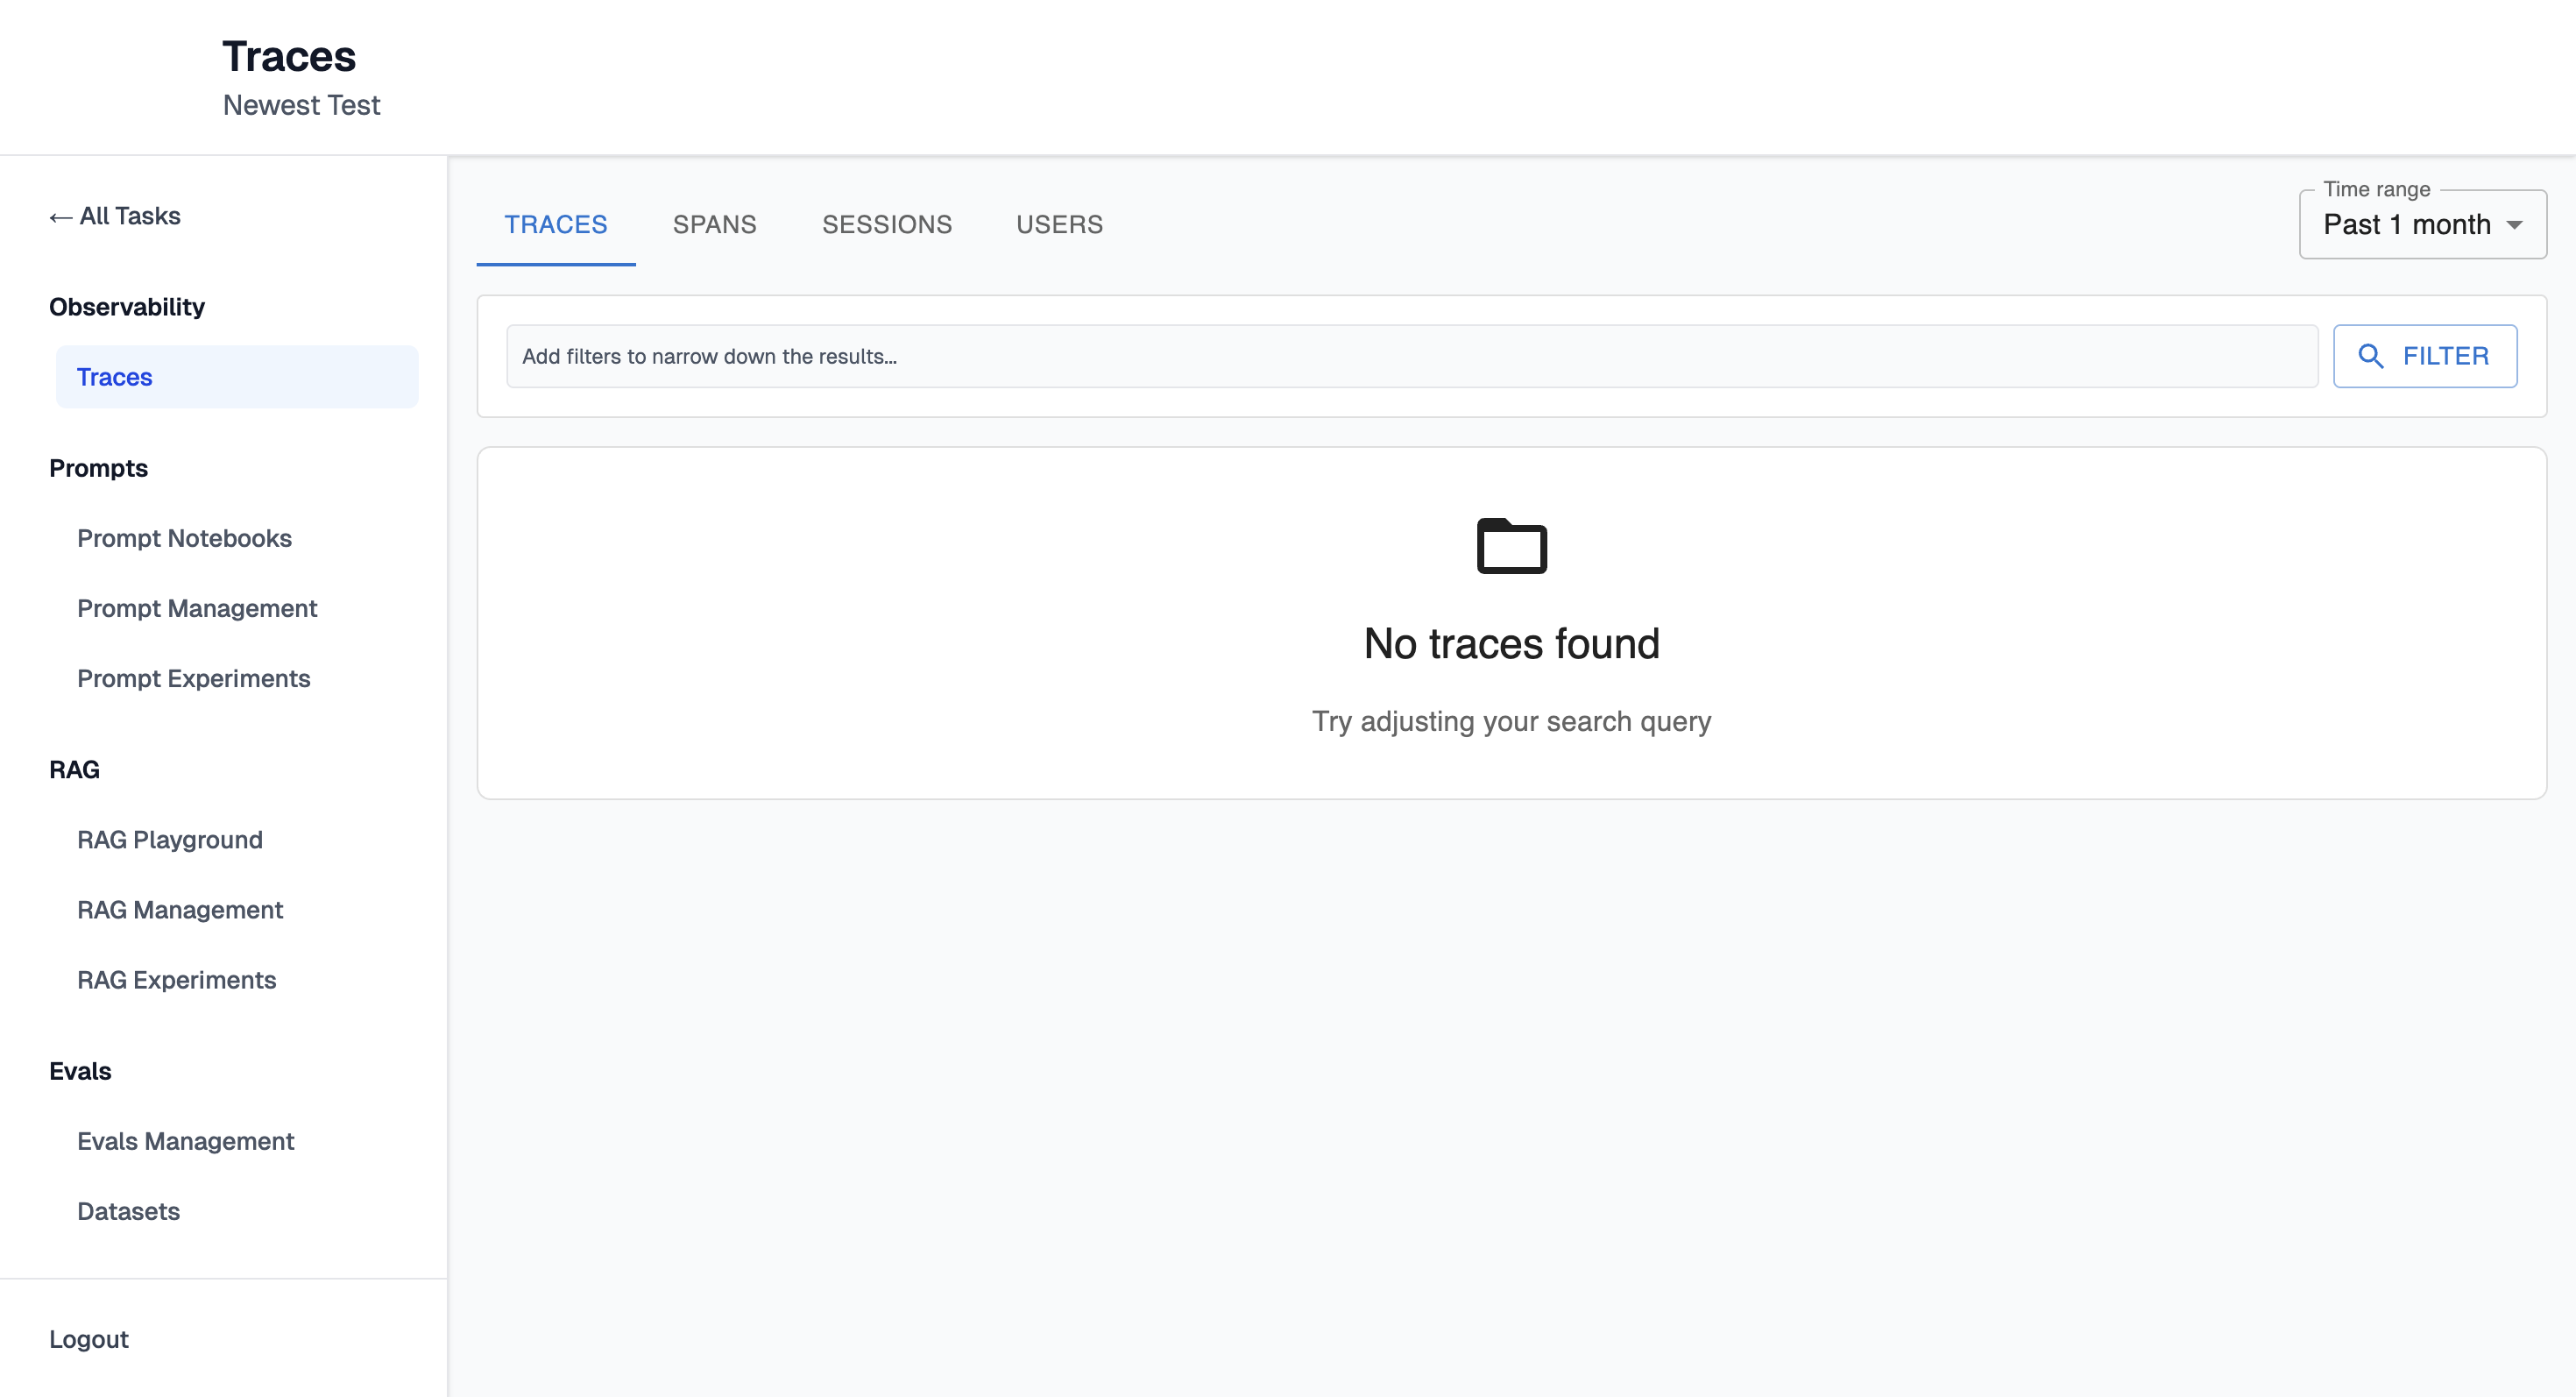
Traces
Traces will be visible here:
View traces with:
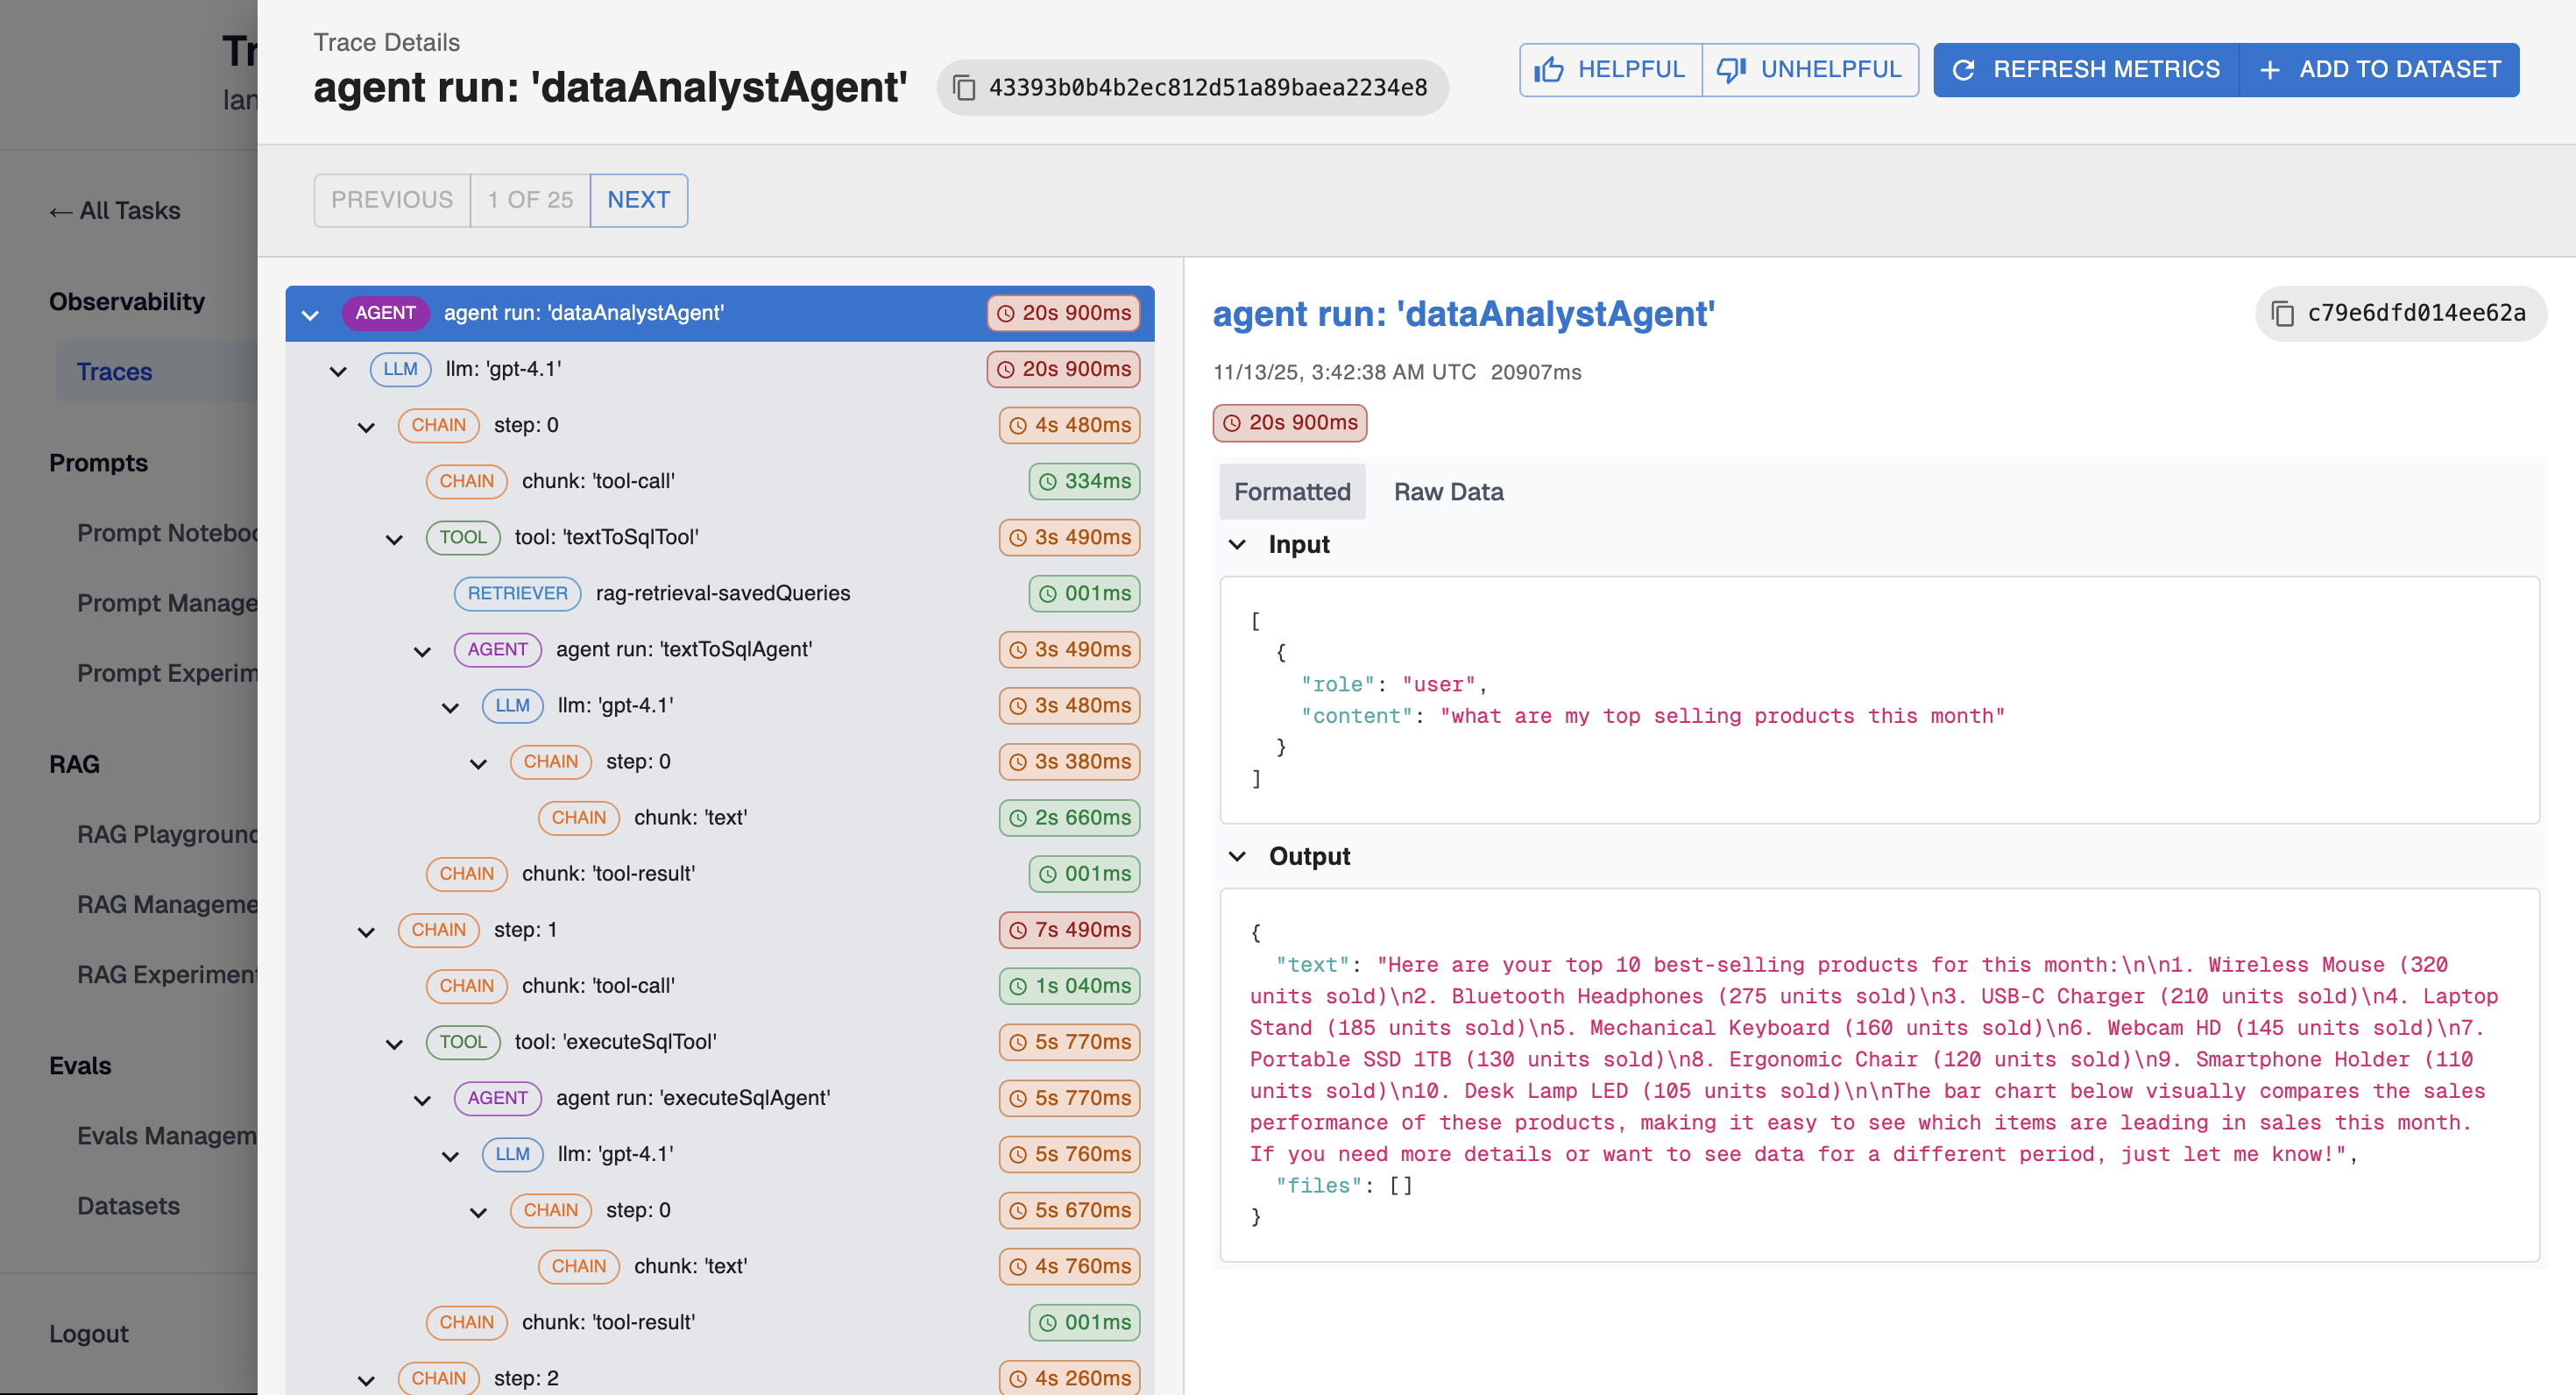
- LLM calls and responses
- Tool invocations
- Agent execution steps
- Timing information
- Input/output data
Filters
You can filter traces by:
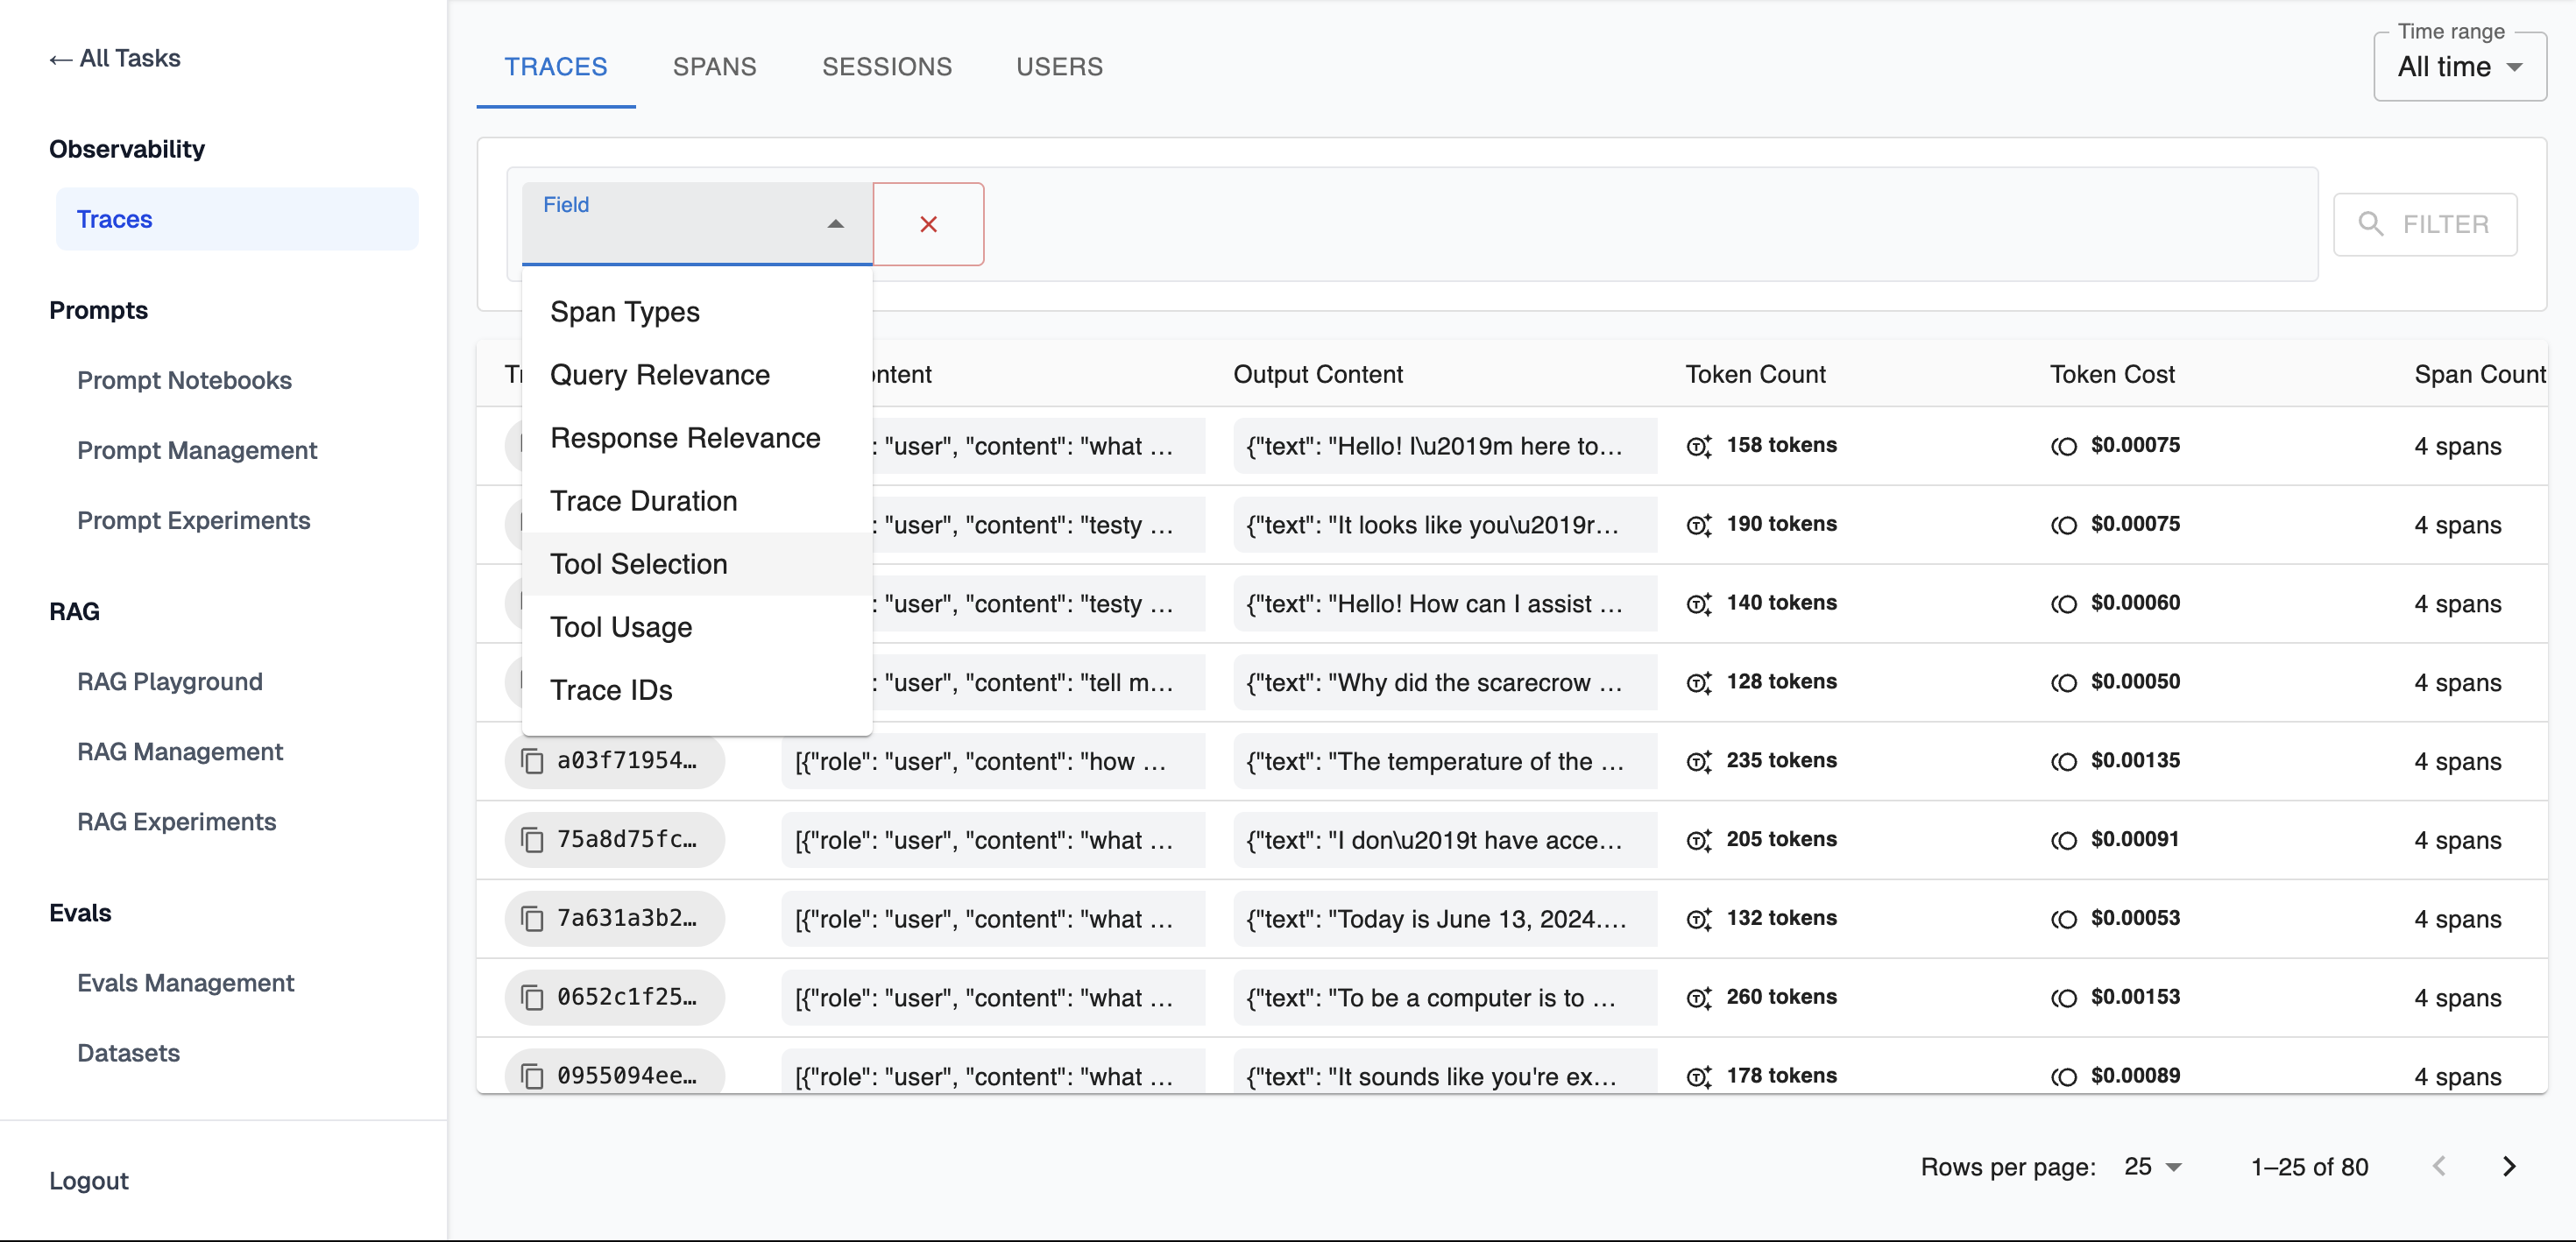
- Span Types
- Query Relevance
- Response Relevance
- Trance Duration
- Took Usage
- Trace IDs
Time range
You can filter traces by selecting the time range during which they occurred:
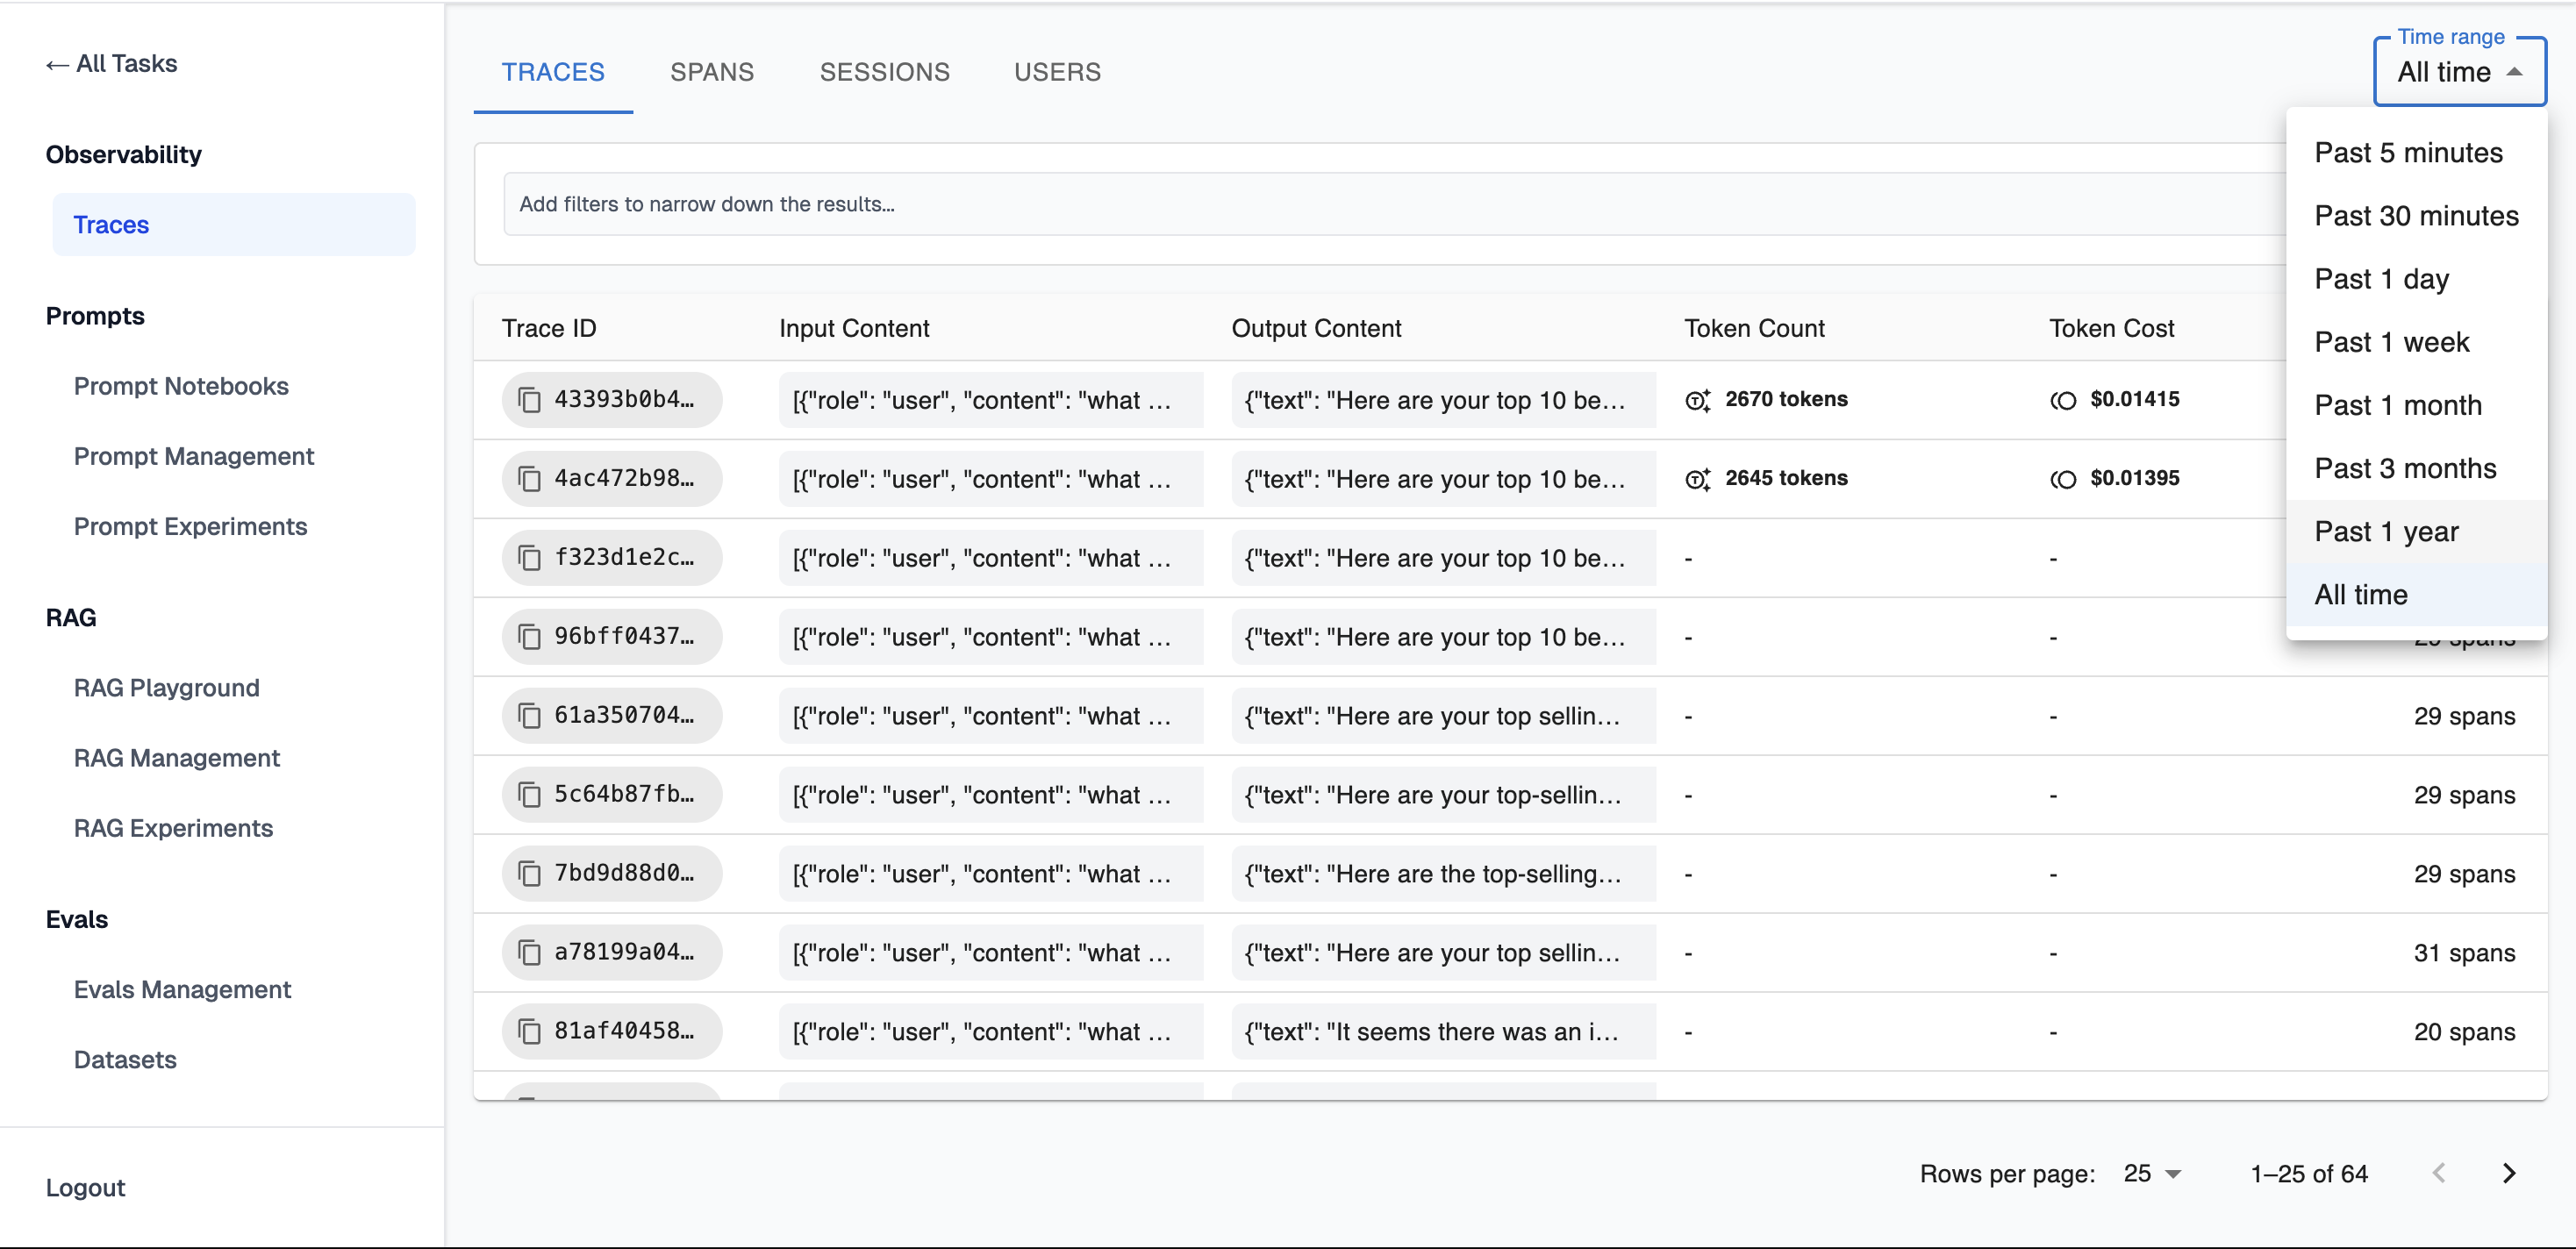
- Past 5 minutes
- Past 30 minutes
- Past 1 day
- Past 1 week
- Past 1 month
- Past 3 months
- Past b1 year
- All time
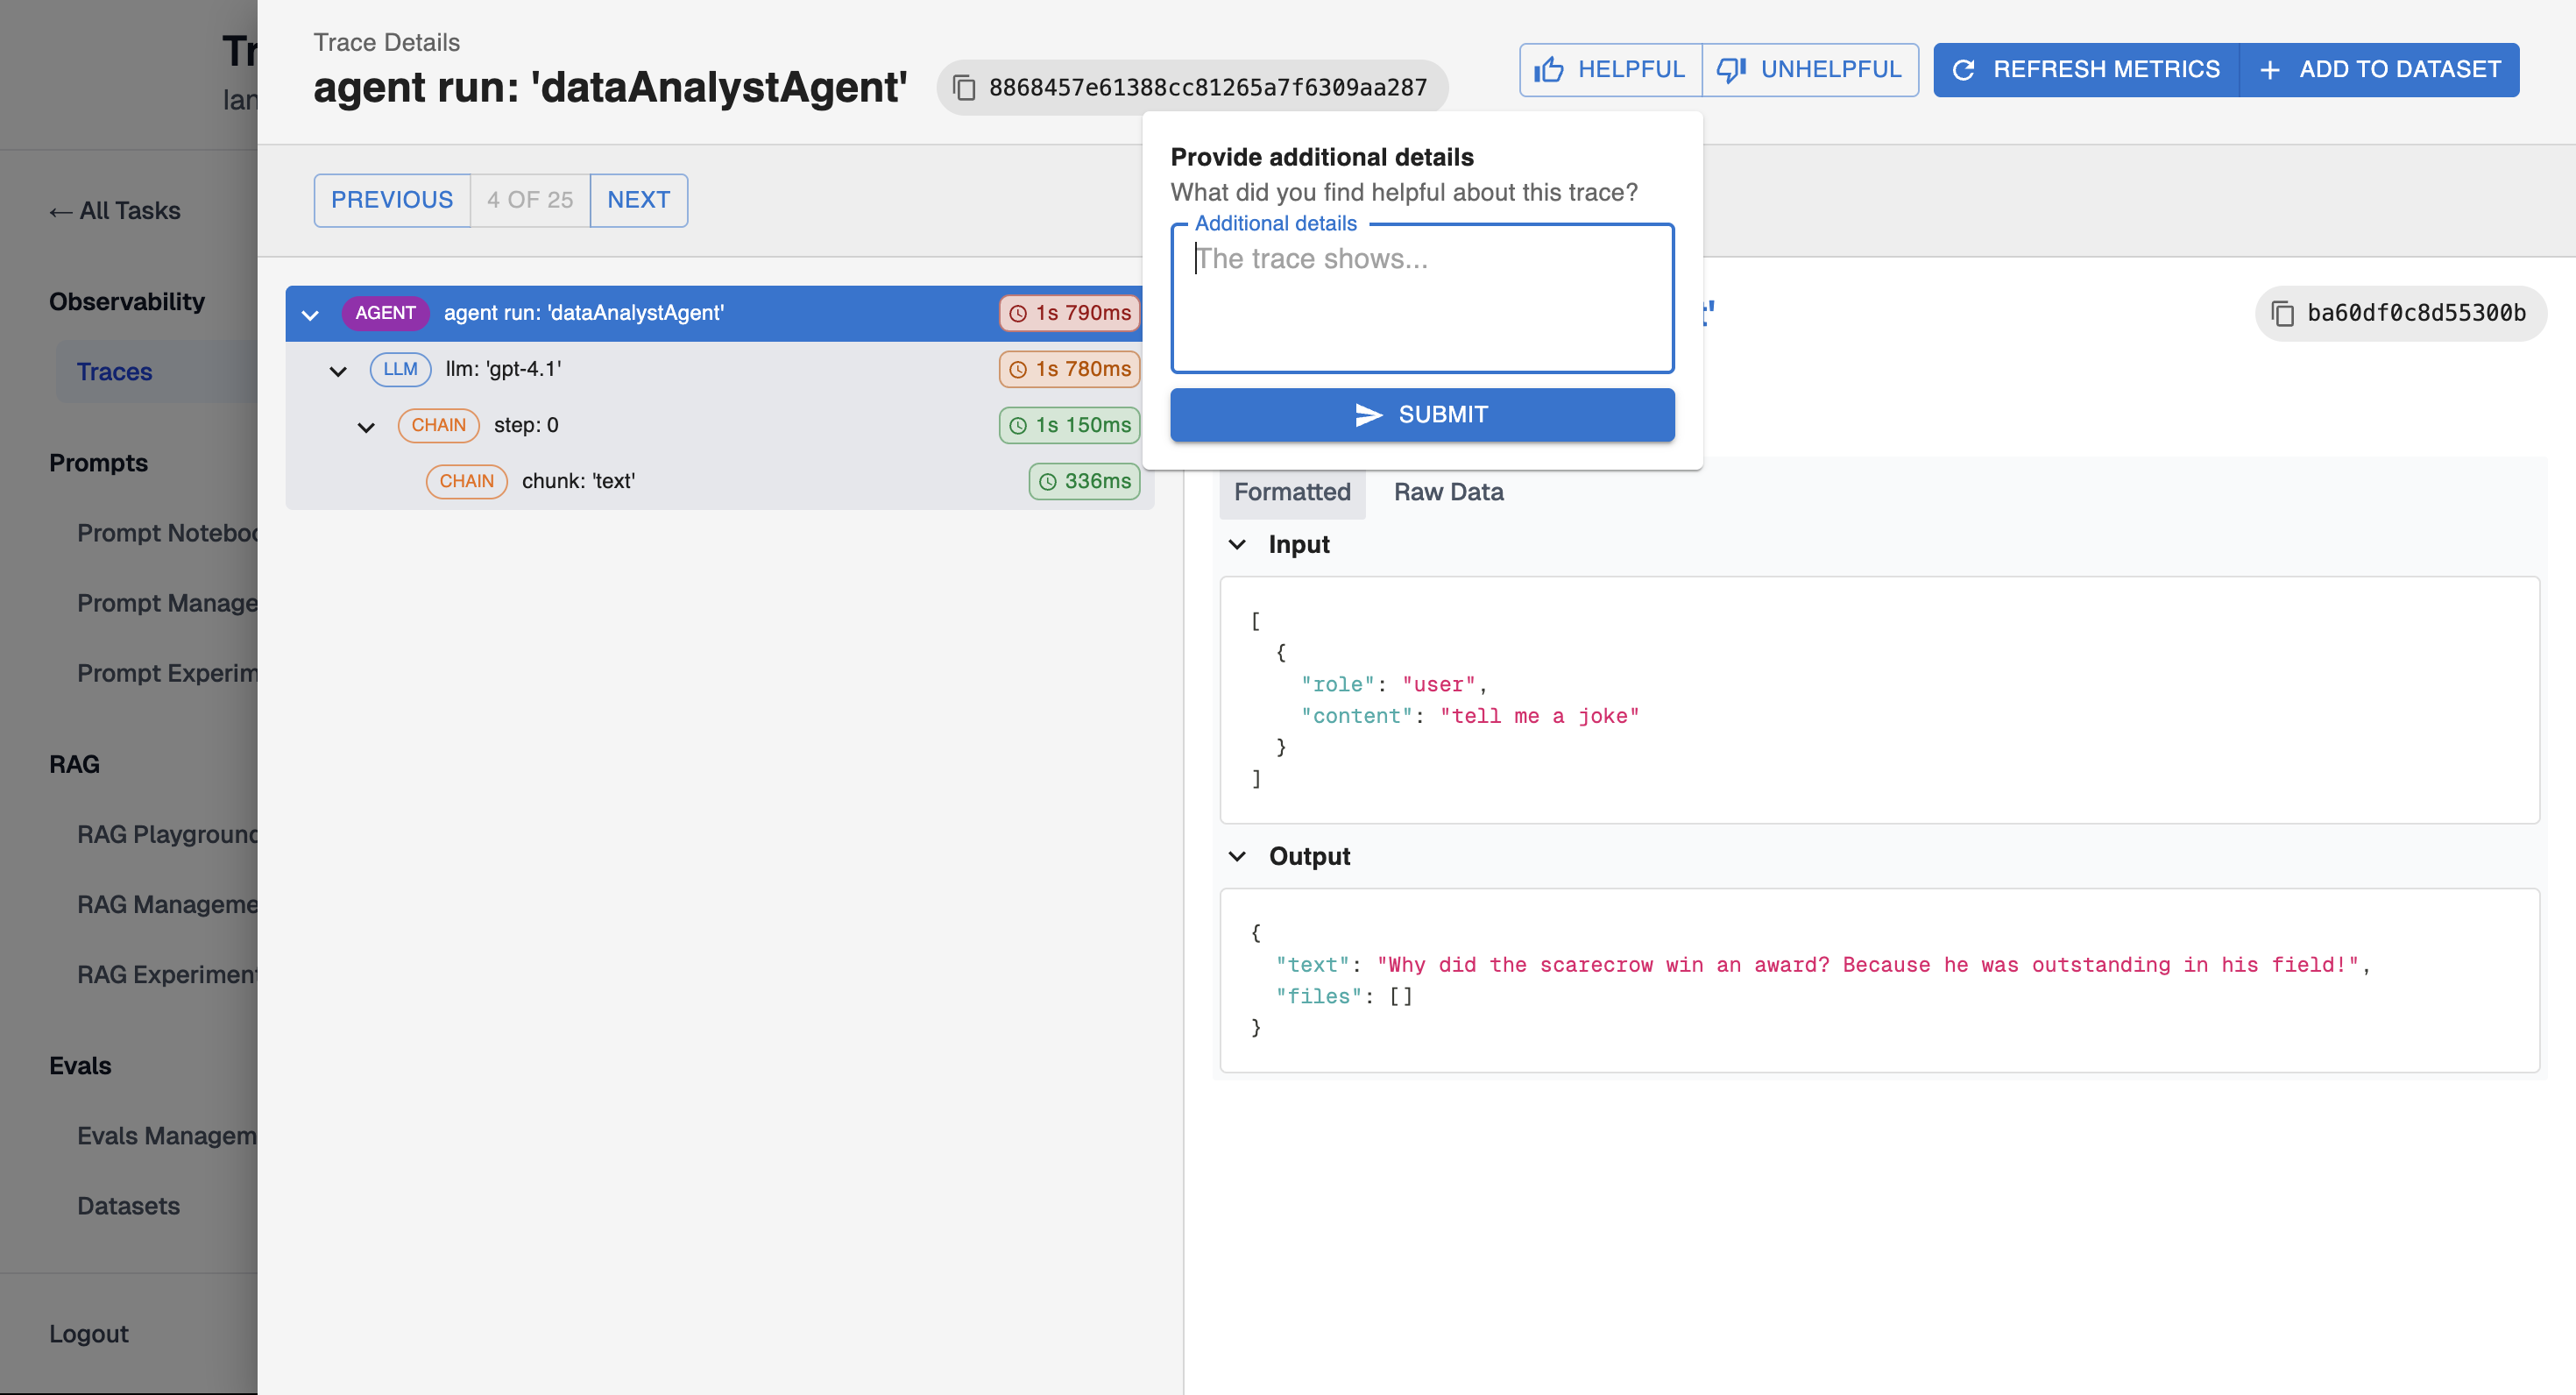
Feedback
You can provide feedback on a trace, indicating what was helpful and what could be improved.
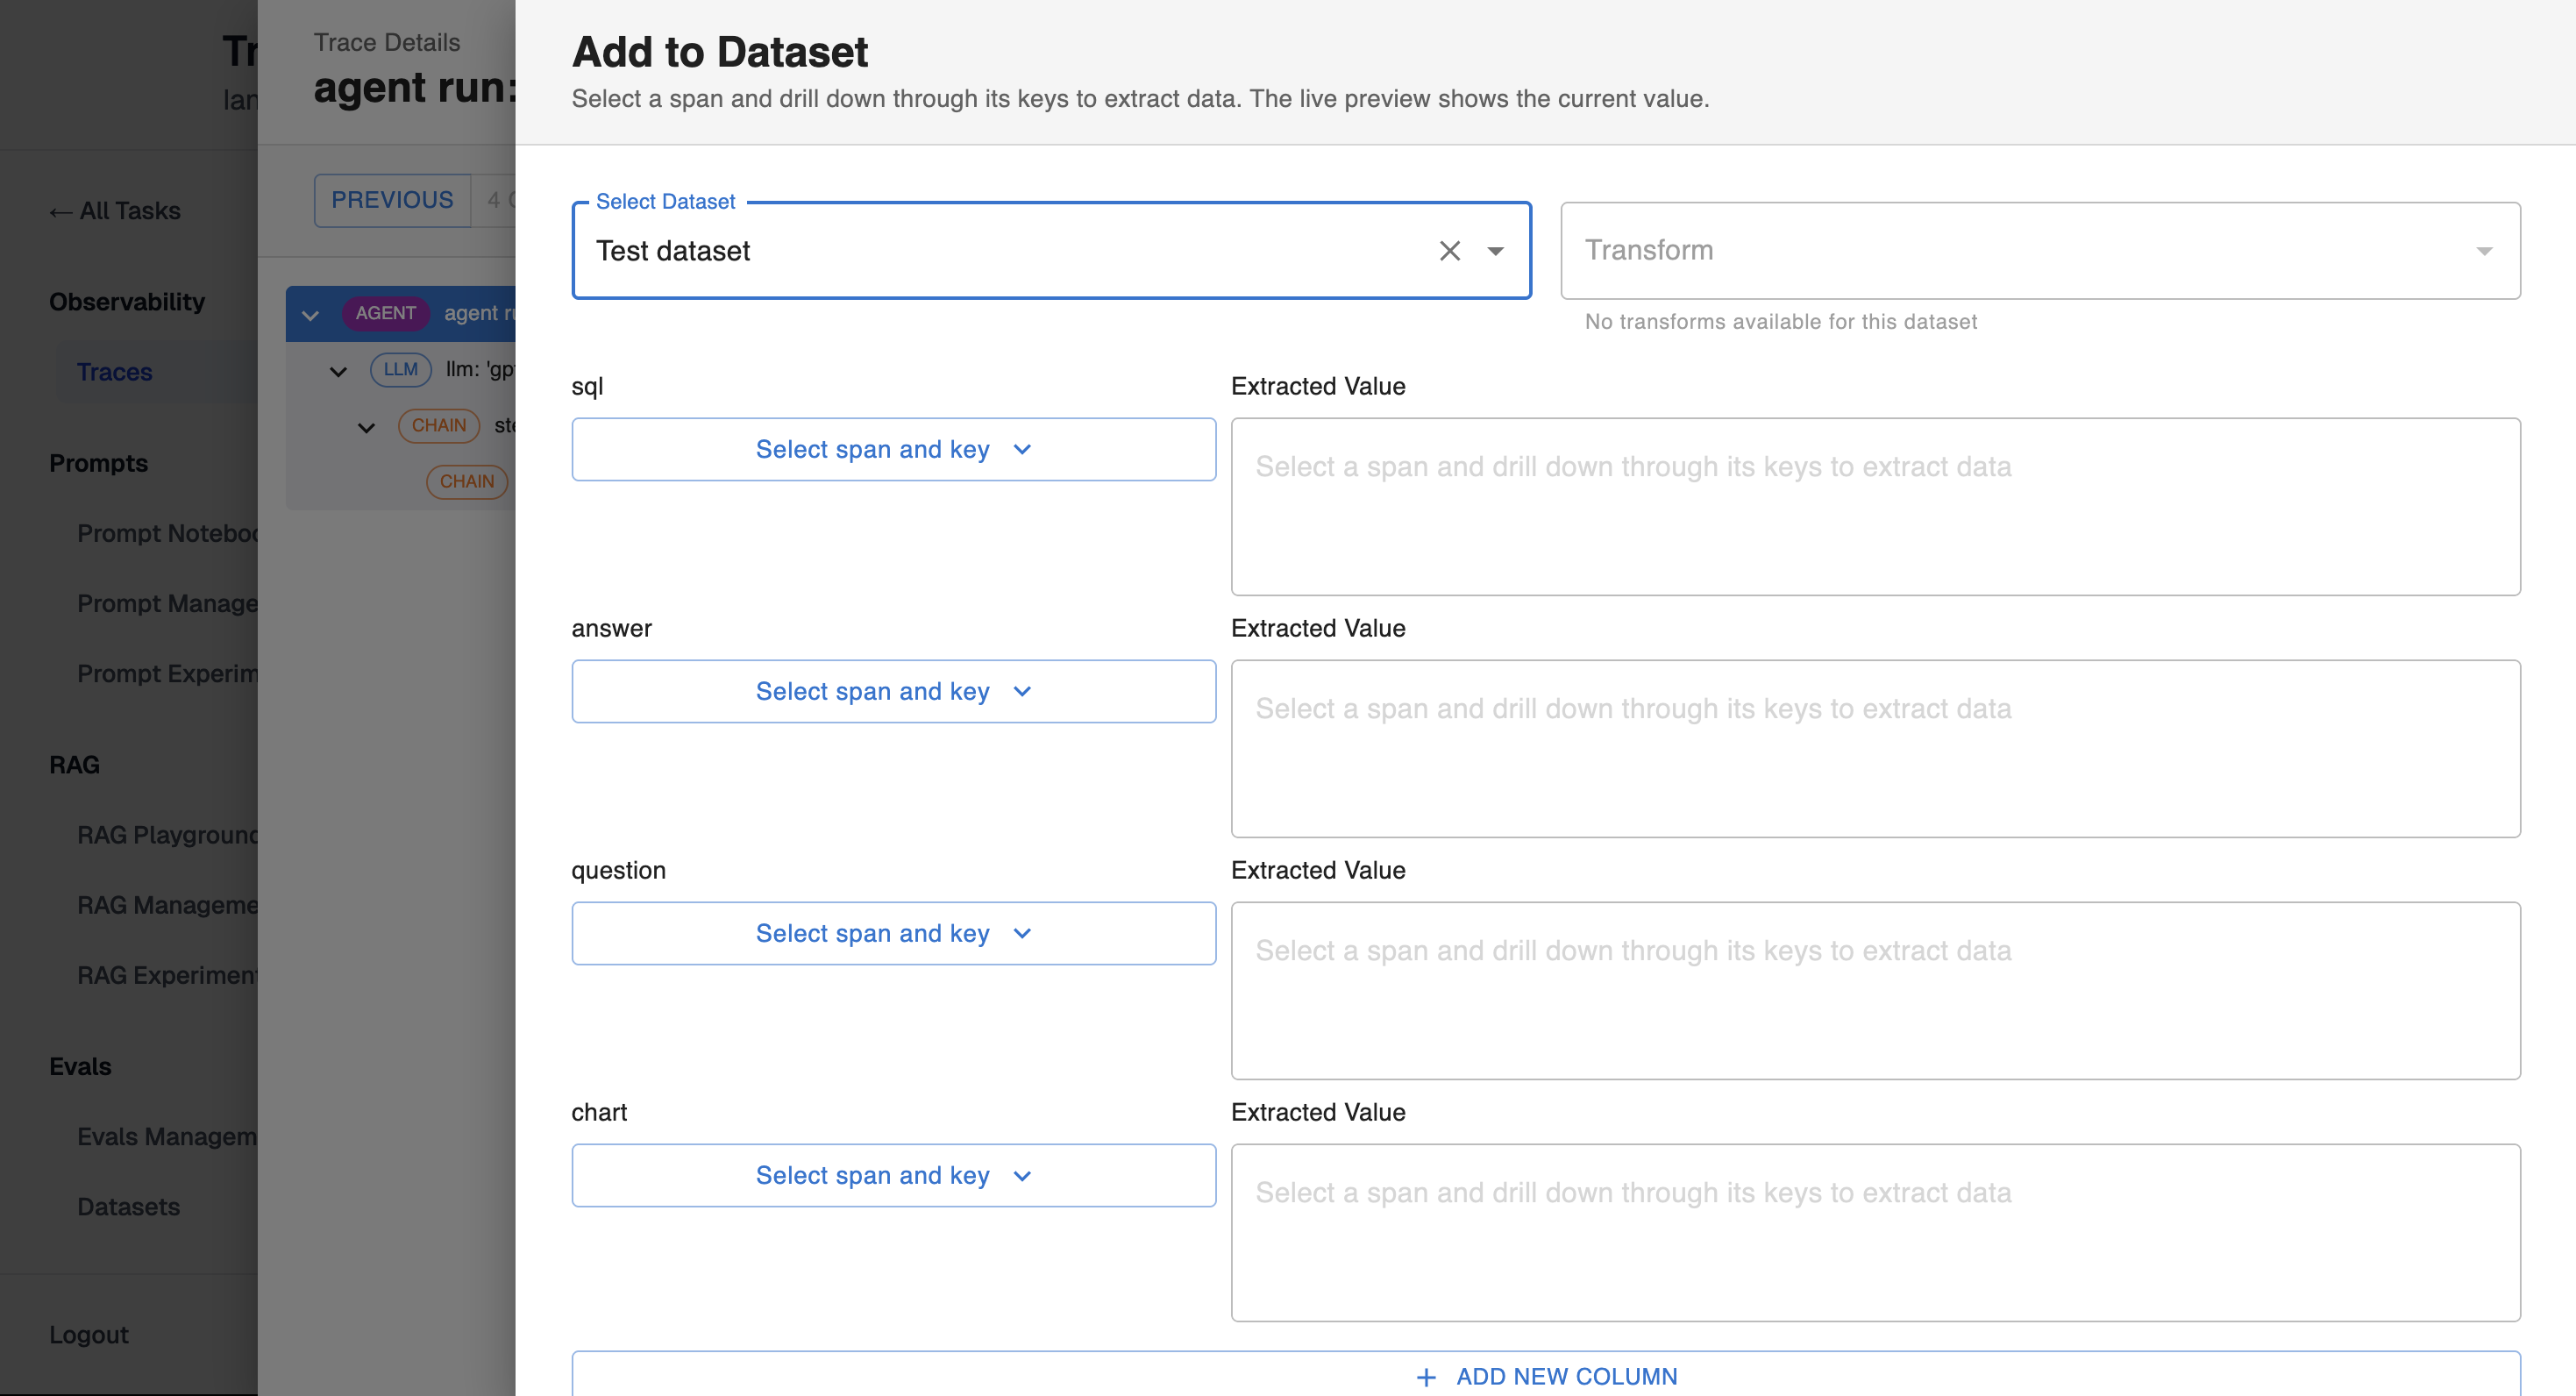
Add to Dataset
You can add a trace to the dataset by assigning its data to the appropriate columns.
Updated 8 months ago
Did this page help you?