Default Metrics
Overview
Arthur computes metrics based on two inputs: the model type configured for the model, and the columns present in tagged dataset rows. Metrics are derived from the combination of model type and tagged row schema — they are not computed automatically for every registered model.
There are two ways metrics get enabled:
-
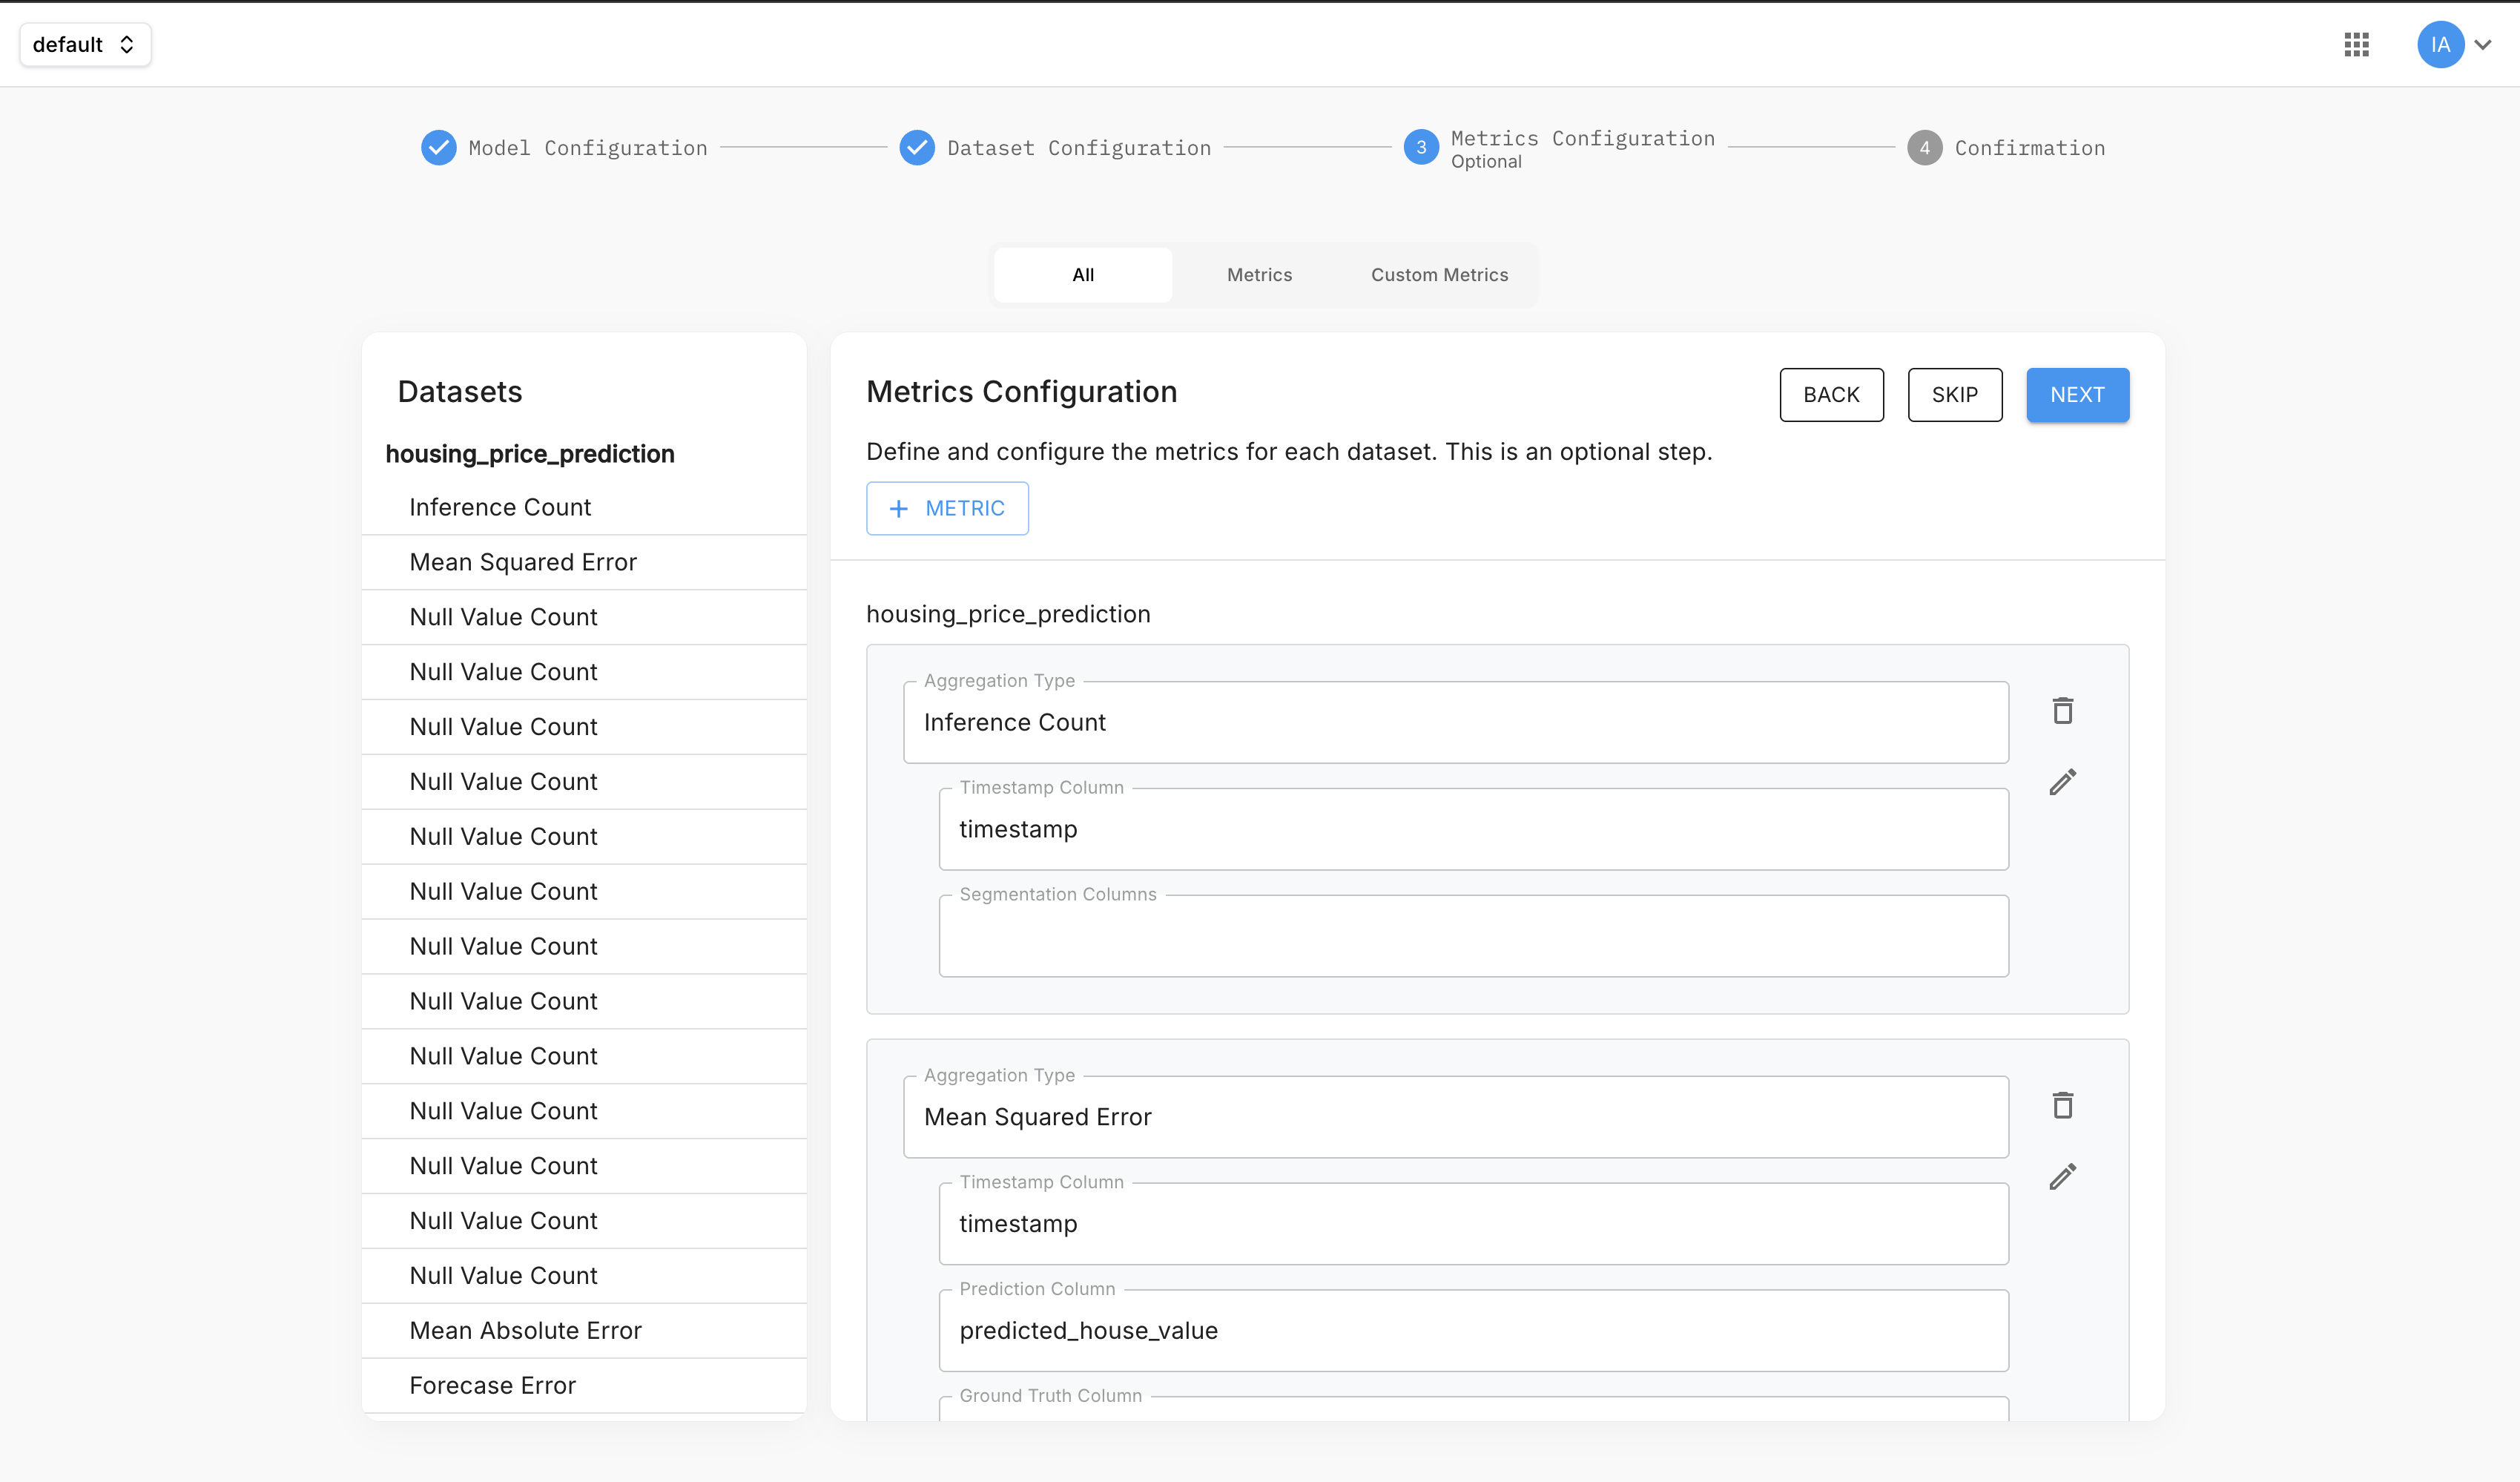
Model type + row tagging — set a model type and tag dataset rows with the appropriate columns; Arthur derives the available metrics from that combination. This happens during the application creation flow as an optional step (step 3 of 4).
-
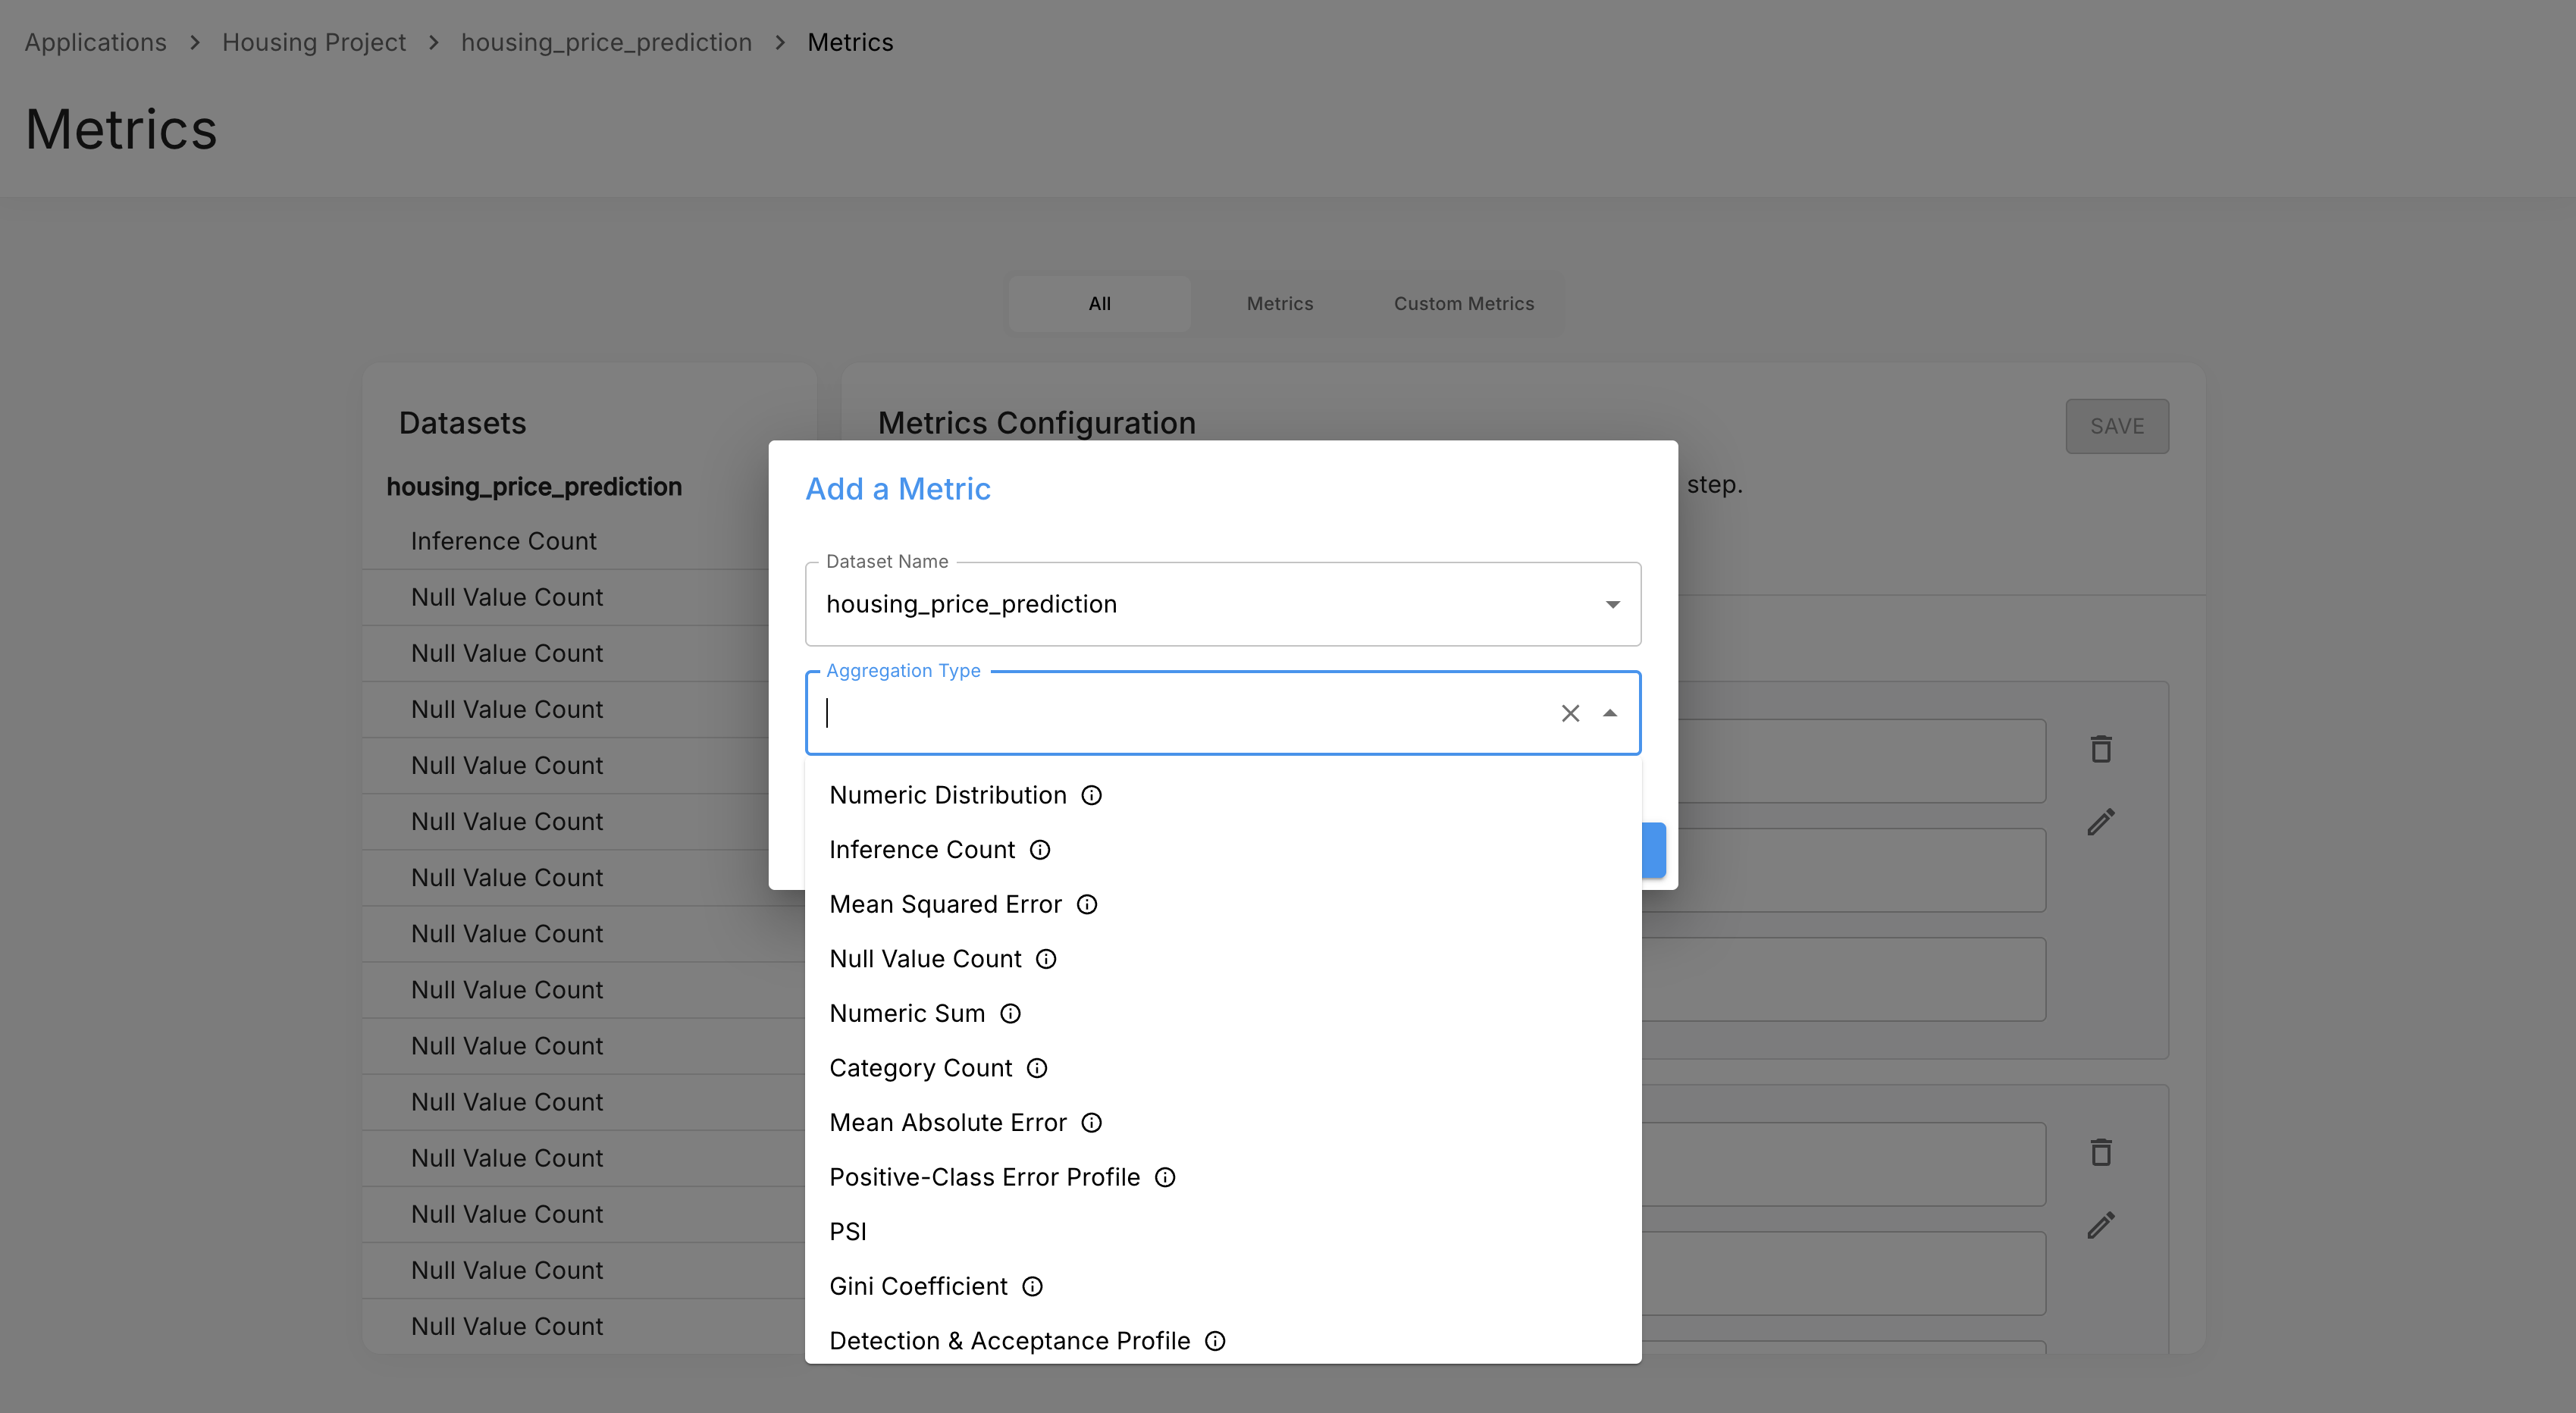
Manual addition — add a metric directly from the Metrics page and assign the rows to it.
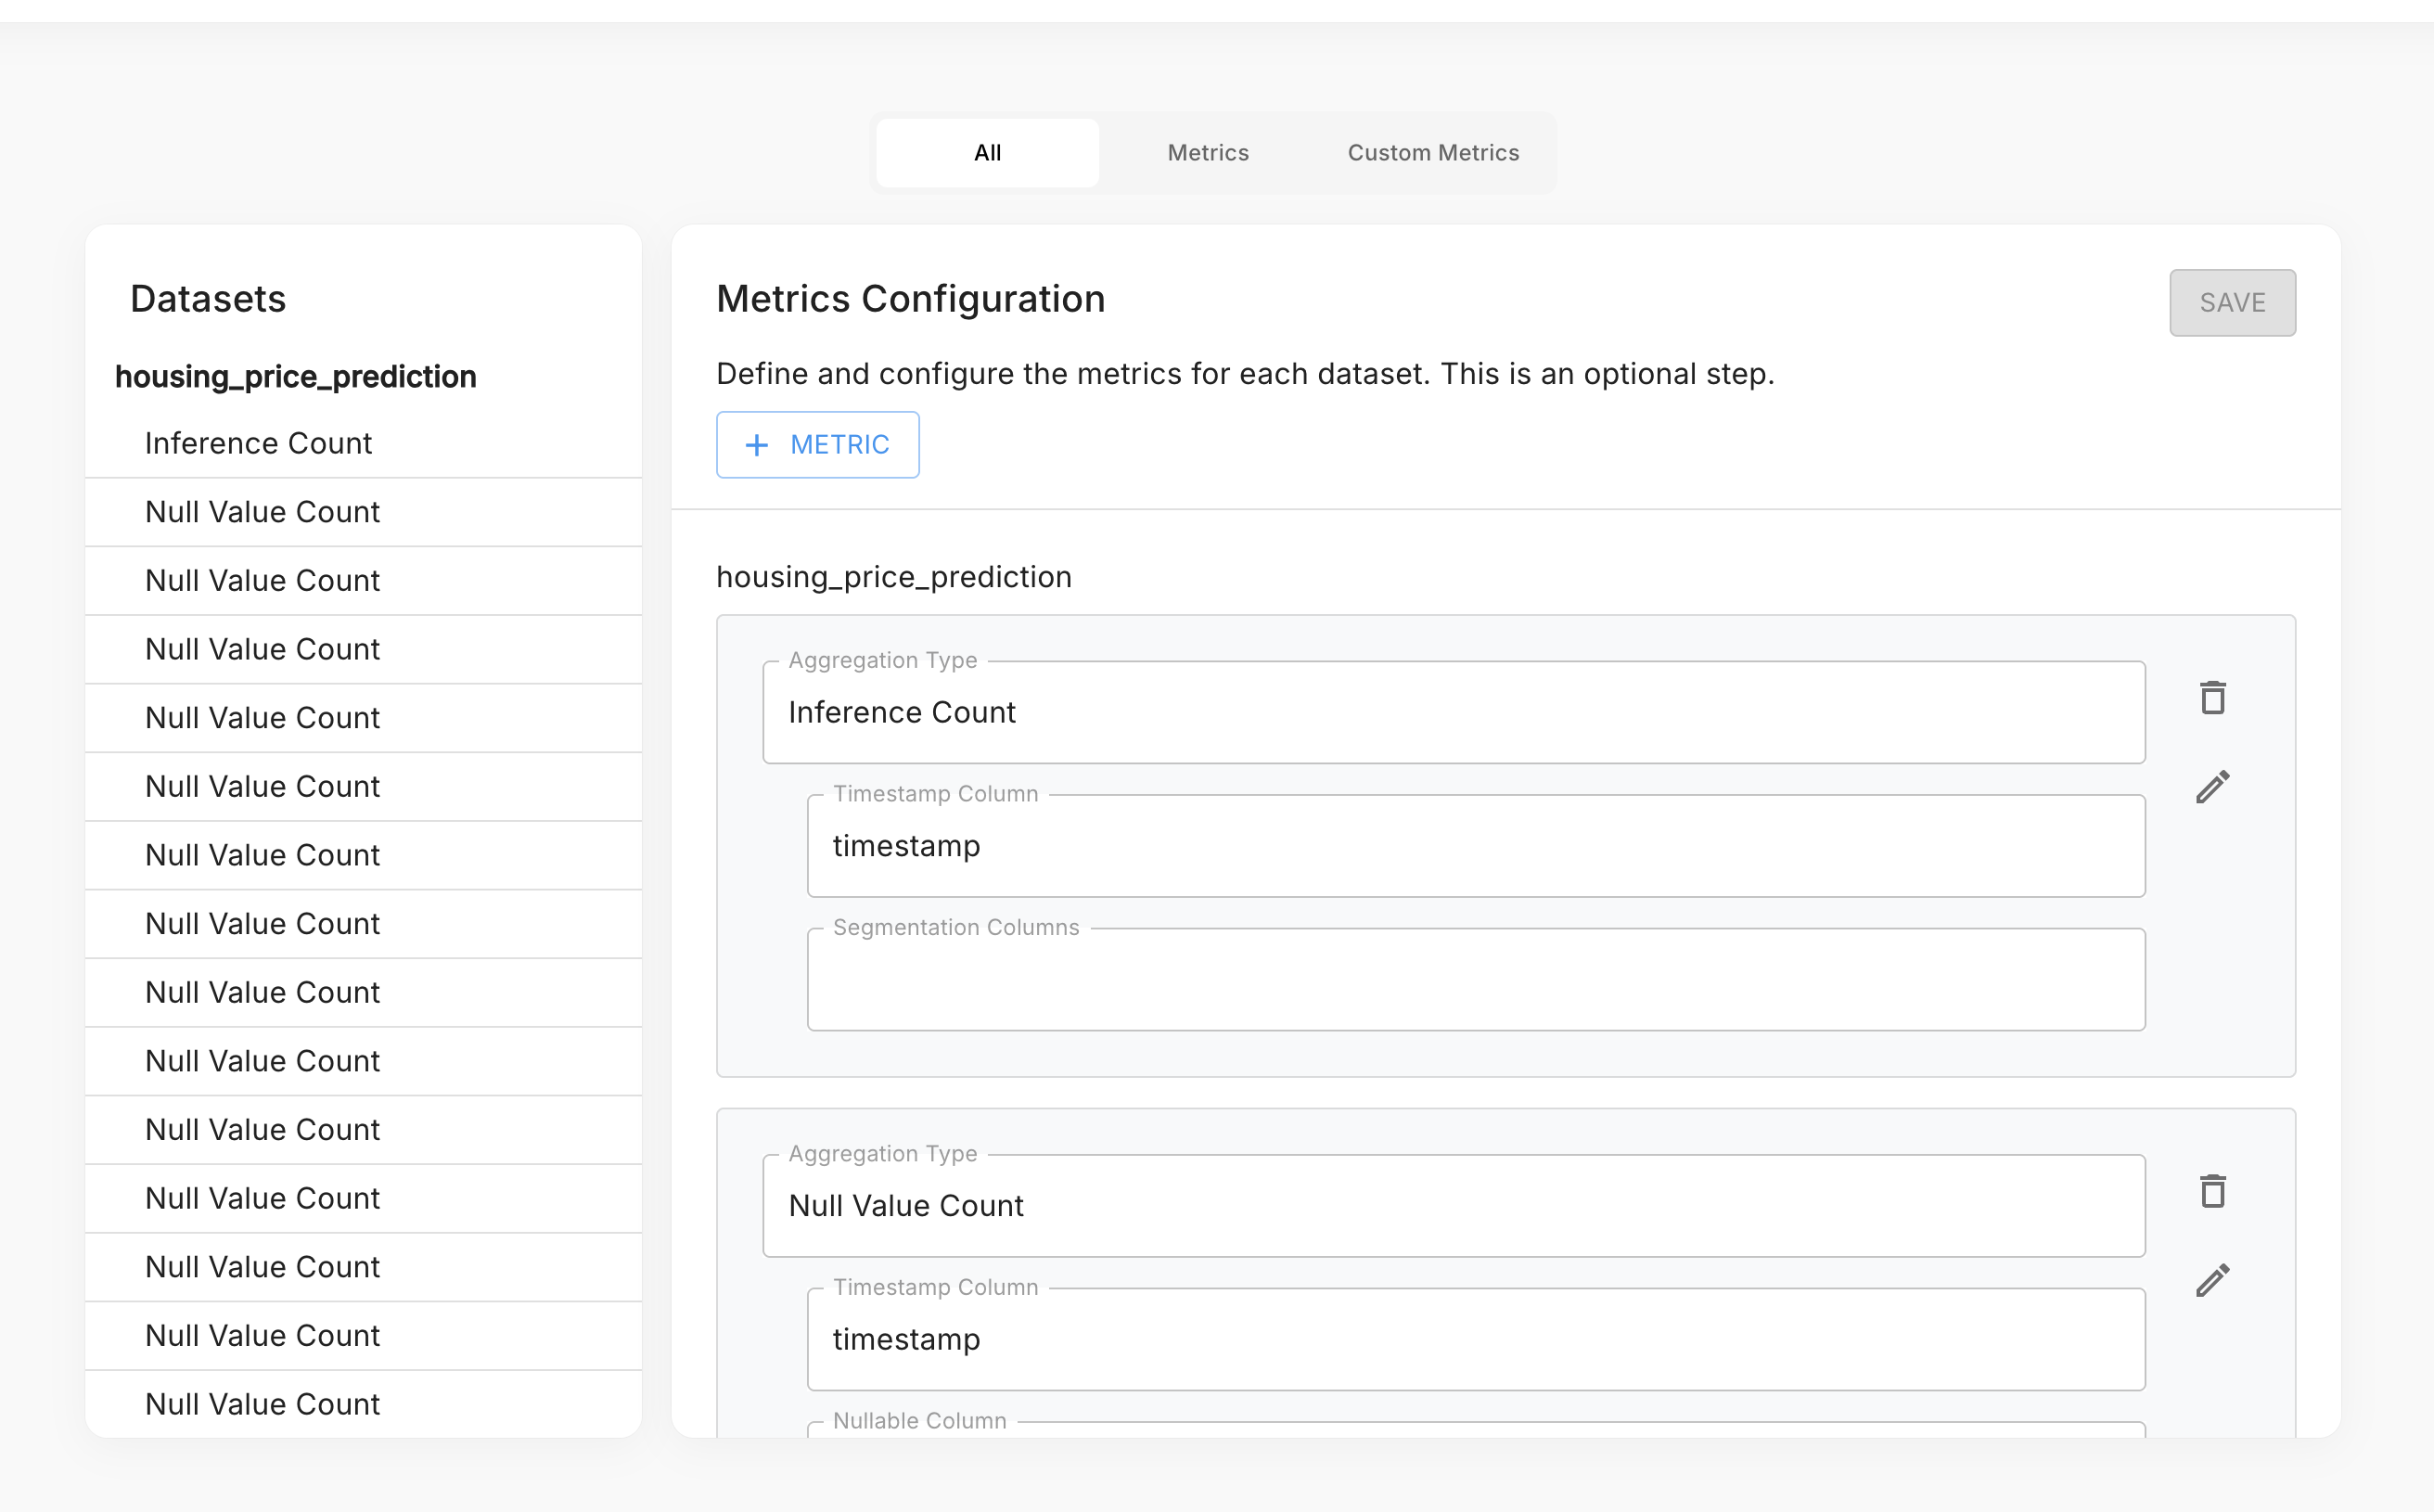
Use the + Metric button to open the metric picker and choose an aggregation type.
Metrics are stored in Arthur's TimescaleDB metrics store and are queryable via SQL. See Metrics Queries for how to write queries against these metrics.
How Metrics Are Stored
Time Buckets
Arthur aggregates inference data into 5-minute windows. Every metric row represents one metric, for one model, over one 5-minute period.
Metric Types
Arthur stores two kinds of metrics:
| Type | Description |
|---|---|
| Numeric | A scalar DOUBLE PRECISION value per bucket — a count, sum, or score |
| Sketch | A serialized KLL float sketch — a compact probabilistic structure for computing approximate quantiles |
Numeric and sketch metrics live in separate views:
metrics_numeric_latest_version— all scalar metricsmetrics_sketch_latest_version— all distributional metrics
Dimensions
Every metric row carries a dimensions JSONB column that tags the data with relevant metadata. Dimensions let you filter and group metrics — for example, by feature column, prediction class, or Shield rule type. Which dimensions are present depends on the metric; they are documented per metric below.
Universal Metrics
These metrics are available for any model type, provided the relevant columns are present in the tagged dataset rows.
Inference Count
Metric name: inference_count
Type: Numeric
Dimensions: none (or custom segmentation columns if configured)
The number of inferences processed in each 5-minute window. Use this to track throughput, detect traffic anomalies, and as a denominator when computing rates.
Null Value Count
Metric name: null_count
Type: Numeric
Dimensions: column_name
The number of null values in a specific column per 5-minute window. Arthur emits one time series per column being monitored. Use this to detect data quality degradation — for example, a feature that starts arriving empty.
Categorical Value Count
Metric name: categorical_count
Type: Numeric
Dimensions: column_name, category
The number of occurrences of each category value in a categorical column per window. Arthur emits one time series per column per category value. Use this to monitor class distribution shifts in categorical features or prediction outputs.
Numeric Distribution
Metric name: numeric_sketch
Type: Sketch
Dimensions: column_name
A distributional sketch of a numeric column's values across each 5-minute window. Arthur emits one sketch series per numeric column being monitored.
Numeric Sum
Metric name: numeric_sum
Type: Numeric
Dimensions: column_name
The sum of values in a numeric column per window. Useful when you need total accumulated values (e.g. total tokens, total spend) or want to reconstruct averages by combining with inference_count.
Regression Metrics
Available when the model type is Regression and dataset rows are tagged with a prediction column and a ground truth column.
Mean Absolute Error
Metric names: absolute_error_sum, absolute_error_count
Type: Numeric
Dimensions: none (or custom segmentation columns if configured)
Arthur stores MAE as two components per 5-minute bucket — absolute_error_sum (the sum of absolute errors) and absolute_error_count (the number of non-null prediction/ground-truth pairs). Summing both across any time window and dividing gives you the correct MAE for that window. See Metrics Queries for example dashboard queries.
Mean Squared Error
Metric names: squared_error_sum, squared_error_count
Type: Numeric
Dimensions: none (or custom segmentation columns if configured)
Stored the same way as MAE — squared_error_sum and squared_error_count separately per bucket. Summing both across a time window and dividing gives MSE; taking the square root gives RMSE. See Metrics Queries for example dashboard queries.
Binary Classification Metrics
Available when the model type is Binary Classification and dataset rows are tagged with a prediction column and a ground truth column. Arthur supports three variants depending on how predictions are represented:
- Int/Bool — predictions are
0/1ortrue/false - String label — predictions are string class labels (e.g.
"positive","negative") - Probability threshold — predictions are continuous probability scores; a threshold is applied to derive the class
All three variants emit the same four metric names.
Confusion Matrix Counts
Metric names: confusion_matrix_true_positive_count, confusion_matrix_false_positive_count, confusion_matrix_false_negative_count, confusion_matrix_true_negative_count
Type: Numeric
Dimensions: prediction_column_name
The four cells of the confusion matrix, accumulated per 5-minute window. Summing these across any time window gives you the confusion matrix for that period, from which you can derive precision, recall, F1, and accuracy. See Metrics Queries for example dashboard queries.
Count by Class
Metric name: binary_classifier_count_by_class
Type: Numeric
Dimensions: prediction (the predicted class value)
The number of predictions in each class per window. Use this to monitor class distribution shifts — for example, detecting when a model starts predicting the positive class far more or less frequently than expected.
Accuracy, Precision, Recall, F1
Derived by summing the confusion matrix counts across any time window and computing:
- Accuracy = (TP + TN) / (TP + FP + FN + TN)
- Precision = TP / (TP + FP)
- Recall = TP / (TP + FN)
- F1 = 2 × (Precision × Recall) / (Precision + Recall)
See Metrics Queries for example dashboard queries that derive these from the confusion matrix counts.
Population Stability Index (PSI)
Metric name: psi
Type: Numeric
Dimensions: column_name
Measures distribution shift for a feature or prediction column relative to a reference baseline. A PSI above 0.2 generally indicates significant distribution drift. Arthur emits one time series per monitored column.
Multiclass Classification Metrics
Available when the model type is Multiclass Classification and dataset rows are tagged with a prediction column and a ground truth column.
Count by Class
Metric name: multiclass_classifier_count_by_class
Type: Numeric
Dimensions: prediction
The number of predictions per class per window. Equivalent to the binary count_by_class but across all classes.
Per-Class Confusion Matrix
Metric names: multiclass_confusion_matrix_single_class_true_positive_count, multiclass_confusion_matrix_single_class_false_positive_count, multiclass_confusion_matrix_single_class_false_negative_count, multiclass_confusion_matrix_single_class_true_negative_count
Type: Numeric
Dimensions: class_label
Arthur computes a one-vs-rest confusion matrix for each class. The class_label dimension identifies which class is treated as "positive" for that row. This gives you per-class precision and recall across all classes in a multiclass model.
Per-Class Accuracy, Precision, Recall, F1
Derived from the per-class confusion matrix counts using the same formulas as binary classification, applied one-vs-rest per class. Use macro averaging (average across all class_label values) for an overall model score, or inspect individual class labels for per-class performance.
Population Stability Index (PSI)
Metric name: psi
Type: Numeric
Dimensions: column_name
Measures distribution shift for a feature or prediction column relative to a reference baseline. A PSI above 0.2 generally indicates significant distribution drift.
Shield Metrics (LLM Safety)
Available when the model type is Arthur Shield and prompt/response rows are tagged appropriately. Shield monitors LLM prompt/response pairs for safety violations across configurable rules.
Inference Pass/Fail Count
Metric name: inference_count
Type: Numeric
Dimensions: inference_result (Pass/Fail), prompt_result (Pass/Fail), response_result (Pass/Fail/null)
The number of inferences per window, broken down by whether they passed or failed Shield checks overall, at the prompt level, and at the response level. Use this to track your overall safety pass rate and to detect spikes in violations.
Rule Result Count
Metric name: rule_count
Type: Numeric
Dimensions: location (prompt or response), rule_type, result (Pass/Fail/Skipped), name, id
The number of rule evaluations per window, grouped by rule identity and result. Use this to see which individual rules are triggering most frequently and on which side of the conversation (prompt vs response).
Hallucination Count
Metric name: hallucination_count
Type: Numeric
Dimensions: none
The number of inferences flagged as containing hallucinations per window. Sum across any time window to get the total hallucination count; divide by inference_count to compute a hallucination rate.
Toxicity Score Distribution
Metric name: toxicity_score
Type: Sketch
Dimensions: rule_result (Pass/Fail), location (prompt or response)
A distributional sketch of toxicity scores across inferences per window.
PII Score Distribution
Metric name: pii_score
Type: Sketch
Dimensions: result, location, entity (e.g. PERSON, US_SSN, US_DRIVER_LICENSE, LOCATION)
A distributional sketch of PII detection scores per entity type per window. The entity dimension identifies the PII category detected (e.g. email, phone_number).
Claim Count Distributions
Metric names: claim_count, claim_valid_count, claim_invalid_count
Type: Sketch
Dimensions: rule_result (Pass/Fail)
For hallucination-detection rules that evaluate factual claims: distributional sketches of the number of claims per inference — total claims evaluated, valid (supported) claims, and invalid (unsupported) claims. Use kll_float_sketch_get_quantile to compute median or percentile claim counts per window.
Rule Latency Distribution
Metric name: rule_latency
Type: Sketch
Dimensions: location, rule_type, result
A distributional sketch of how long each Shield rule takes to evaluate per window. Use this to monitor the performance impact of individual rules and detect latency regressions when rules are updated.
Token Count
Metric name: token_count
Type: Numeric
Dimensions: location (prompt or response), model_name, conversation_id, user_id
The number of tokens processed per window, split by prompt and response. Use this to track token consumption trends and forecast costs.
Token Cost
Metric name: token_cost.{model_name} (e.g. token_cost.claude-opus-4-6)
Type: Numeric
Dimensions: model_name
Estimated cost in USD per window, derived from token counts using published pricing for supported models. The metric name is dynamic — it includes the model name as a suffix.
Agentic / LLM Trace Metrics
Available when the model type is Agentic Trace and trace rows are tagged appropriately. These metrics cover multi-step LLM workflows instrumented with Arthur's tracing SDK.
Trace Count
Metric name: trace_count
Type: Numeric
Dimensions: user_id
The number of agentic traces completed per window.
Trace Latency
Metric name: trace_latency
Type: Sketch
Dimensions: none
End-to-end latency distribution for agentic traces per window.
Annotation Count
Metric name: annotation_count
Type: Numeric
Dimensions: user_id, annotation_score, run_status, continuous_eval_name, eval_name, eval_version, annotation_type
The number of evaluation annotations per window, broken down by evaluator and result. Use this to track evaluation coverage and score distributions over time.
Token Counts
Metric names: total_token_count_sum, prompt_token_count_sum, completion_token_count_sum
Type: Numeric
Metric names: total_token_count_distribution, prompt_token_count_distribution, completion_token_count_distribution
Type: Sketch
Total, prompt, and completion token counts per window, available both as sums (for totals) and as distributional sketches.
Token Costs
Metric names: total_token_cost_sum, prompt_token_cost_sum, completion_token_cost_sum
Type: Numeric
Metric names: total_token_cost_distribution, prompt_token_cost_distribution, completion_token_cost_distribution
Type: Sketch
Estimated cost in USD per window for total, prompt, and completion tokens. Available as sums and as distributional sketches.
Annotation Cost
Metric names: annotation_cost_sum
Type: Numeric
Metric names: annotation_cost_distribution
Type: Sketch
Estimated cost of running evaluators per window — useful for tracking evaluation spend alongside inference spend.
Span Metrics
Span-level equivalents of the token and cost metrics above, for workflows that instrument individual steps (spans) within a trace. A span is a single instrumented operation — an LLM call, tool invocation, or other step — within a trace.
Metric names: span_count, span_total_token_count_sum, span_prompt_token_count_sum, span_completion_token_count_sum, span_total_token_cost_sum, span_prompt_token_cost_sum, span_completion_token_cost_sum
Type: Numeric
Dimensions: span_name, span_kind, model_name
span_count is the number of individual spans within each 5-minute window. The remaining metrics are token counts and costs accumulated across all spans in that window.
Metric names: span_total_token_count_distribution, span_prompt_token_count_distribution, span_completion_token_count_distribution, span_total_token_cost_distribution, span_prompt_token_cost_distribution, span_completion_token_cost_distribution
Type: Sketch
Dimensions: span_name, span_kind, model_name
Token counts and costs measured at the individual span level, rather than aggregated across the full trace. Where trace-level token metrics show total resource consumption per trace, span metrics let you see which specific steps — identified by span_name and span_kind (e.g. LLM, TOOL) — consumed the most tokens and incurred the most cost.
Next Steps
- Metrics Queries — Learn how to write SQL queries against the TimescaleDB metrics store, including how to aggregate numeric metrics and merge sketch metrics for percentile analysis.
- Custom Metrics — Define your own metric logic when the default set doesn't cover your use case.
- Alert Rules — Set up threshold-based alerts that fire when a metric crosses a boundary, using the same metric names documented here.
- Custom Graphs — Build dashboards that visualize default and custom metrics over time.
Updated 2 months ago