Observe & Dashboard
Arthur's observability interface is organized as a three-level hierarchy: Workspace → Project → Application. Each level gives you a progressively narrower, more detailed view of your AI systems. This page orients you to that hierarchy, walks you through each level in order, and explains the key metrics you'll encounter along the way. By the end, you'll know exactly where to look — whether you're checking overall system health or drilling into a single application's traces.
How do I navigate the Arthur platform to find what I need — from workspace-level health down to a specific application's trace drill-down?
Dashboard Hierarchy
Before clicking anything, understand the structure. Every screen in Arthur's Observe section belongs to one of three levels:
graph TD
    A["🏢 Workspace<br/>(Organization-wide view)<br/>All projects, all applications, aggregate health"] --> B["📁 Project<br/>(Logical grouping)<br/>Applications sharing a domain or team"]
    B --> C["⚙️ Application<br/>(Single AI system)<br/>Traces, sessions, metrics, policy compliance"]

    style A fill:#1a1a2e,color:#e0e0ff,stroke:#6c63ff
    style B fill:#16213e,color:#e0e0ff,stroke:#6c63ff
    style C fill:#0f3460,color:#e0e0ff,stroke:#6c63ff
| Level | Scope | Primary Questions Answered |
|---|---|---|
| Workspace | All projects and applications | Is anything broken across my entire AI estate? |
| Project | A subset of applications | How is this team's or domain's AI performing? |
| Application | One AI system | What exactly happened in this trace or session? |
Navigation tip: Use the breadcrumb trail at the top of each page (
Project Name > Application Name) to move back up the hierarchy. The left sidebar contains four icon-only items: Home, Applications, Analytics, and Governance.
Create a Project
Projects are the organizational containers that group related applications together. You should create a project before registering any applications.
Steps
- Navigate to the Workspace Home (
/workspaces/:id). - Click + New Project in the page header.
- In the modal, enter a Project Name and optional Description.
- Click Create Project.
Once created, your project appears in the workspace applications list and can be used to filter applications.
Note: Project creation is a modal dialog on the workspace home page — there is no separate project creation page.
Best practice: Organize projects by team, business domain, or deployment environment (e.g.,
fraud-detection-prod,customer-support-staging). Avoid creating one project per application — that defeats the purpose of the hierarchy.
Configure Your Workspace
Workspace configuration is accessed via the user avatar dropdown in the top-right corner of the navigation bar. There is no dedicated "Settings" page — each option links directly to its management view.
Configuration options
Identity & Access
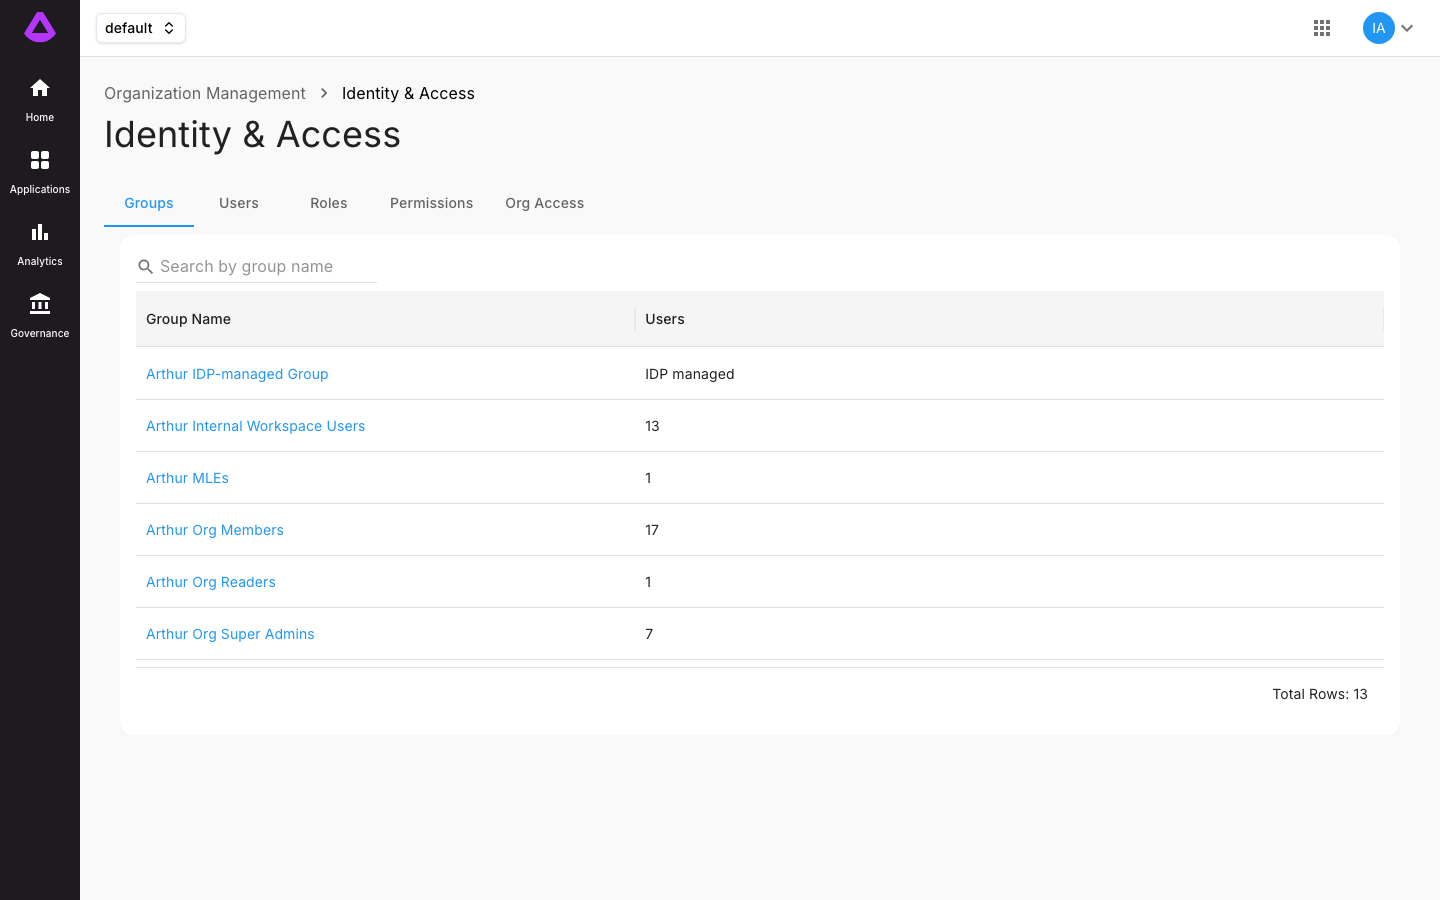
Manage organization-level identity and IAM at /org-management/iam. Accessible via avatar dropdown → Identity & Access.
User Management
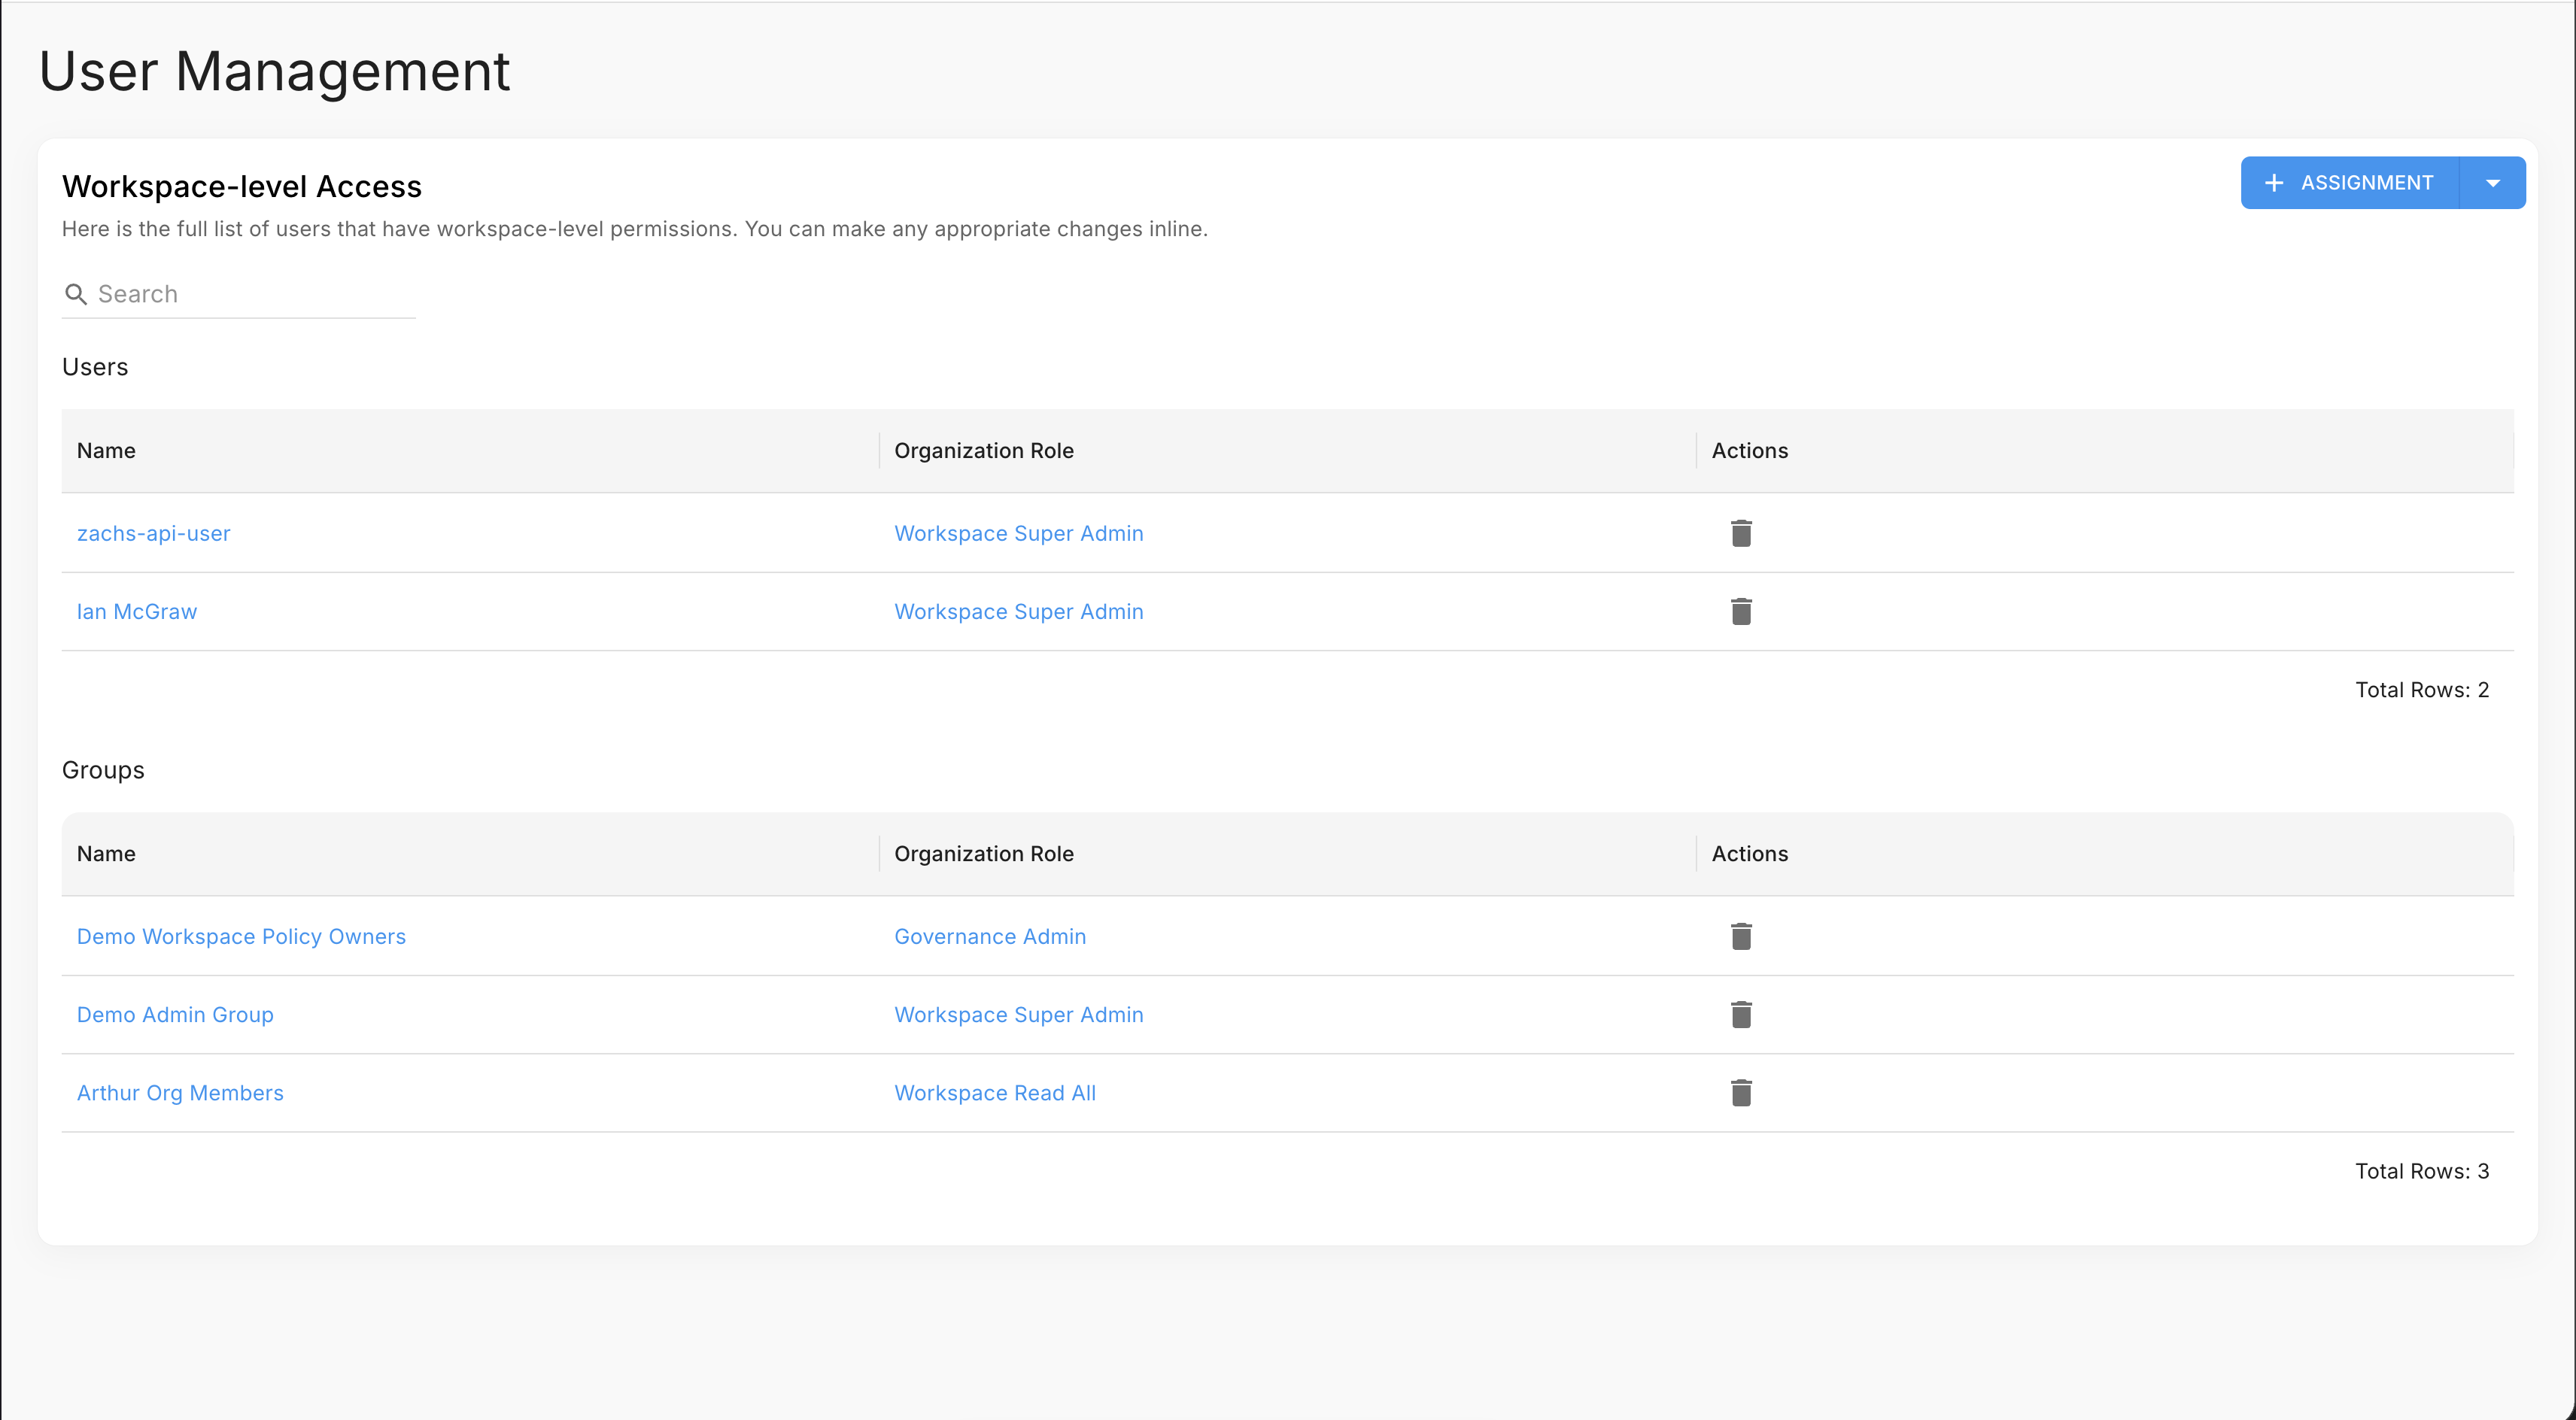
Add users and assign workspace-level roles at /workspaces/:id/user-management. Accessible via avatar dropdown → User Management. Arthur uses role-based access control (RBAC) scoped at both workspace and project level.
Engine Management
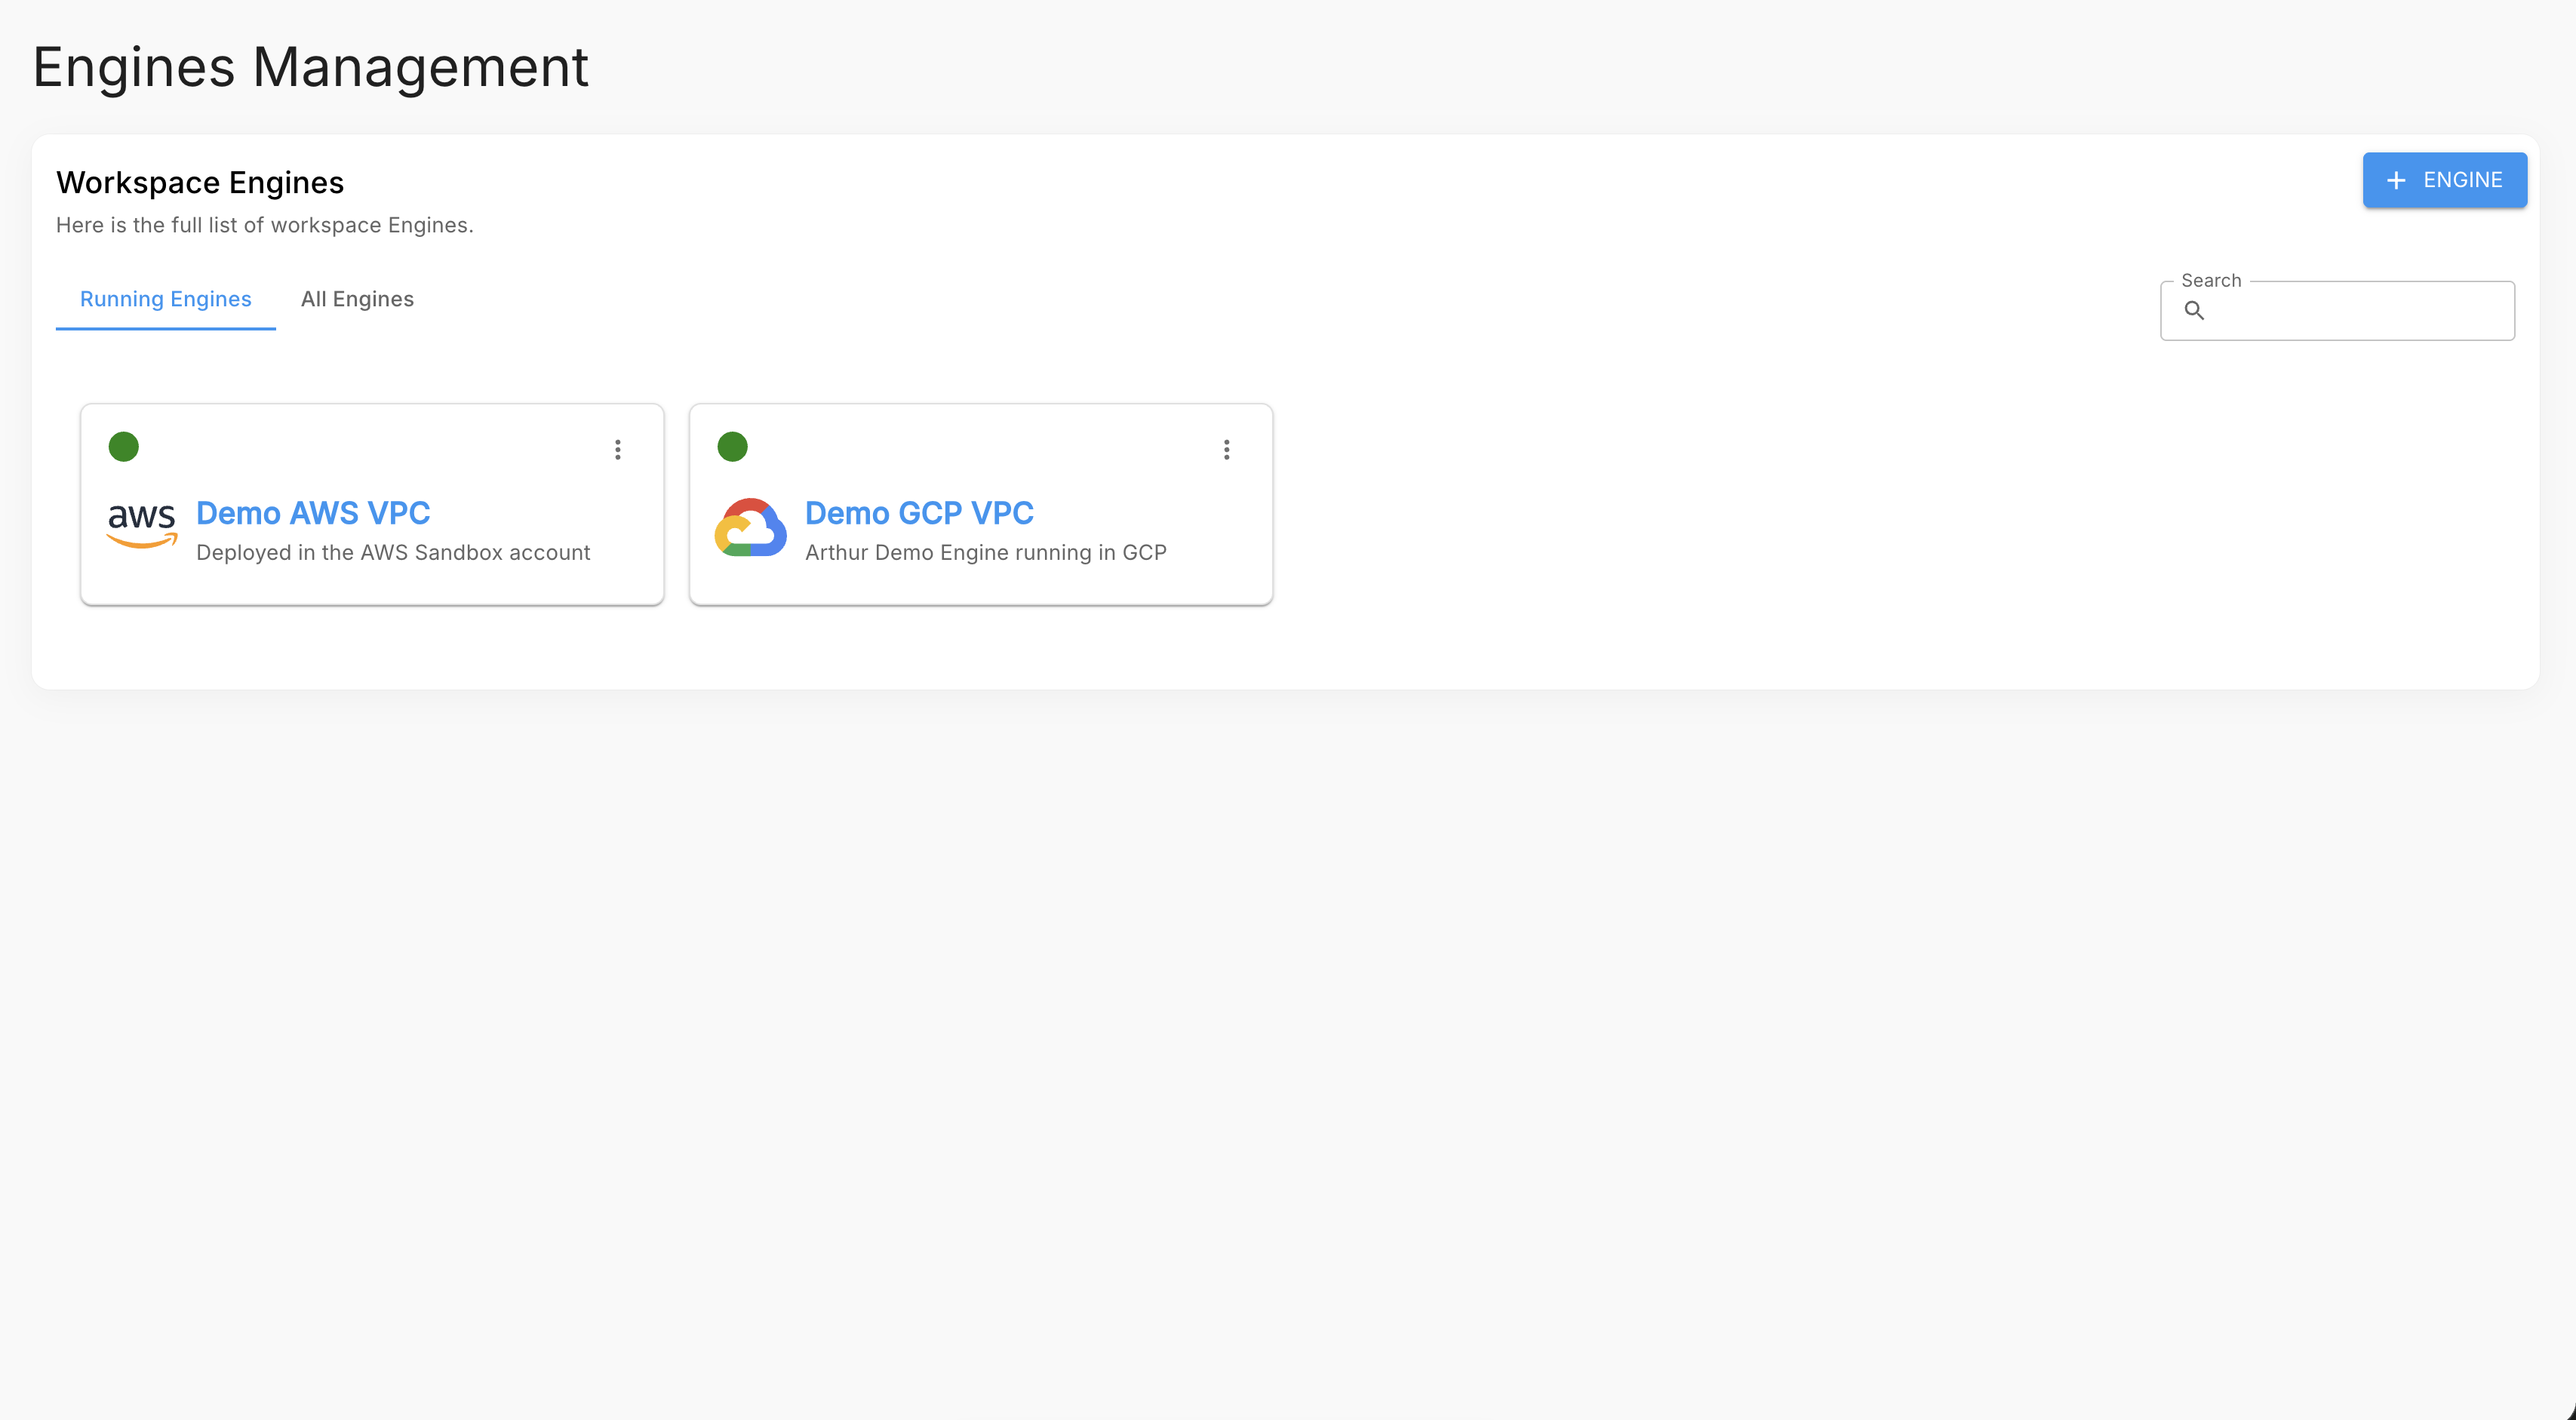
Register and manage Arthur engines connected to this workspace at /workspaces/:id/engines. Accessible via avatar dropdown → Engine Management. A workspace can have multiple engines, but each engine belongs to one workspace and cannot be shared across workspaces.
Webhooks
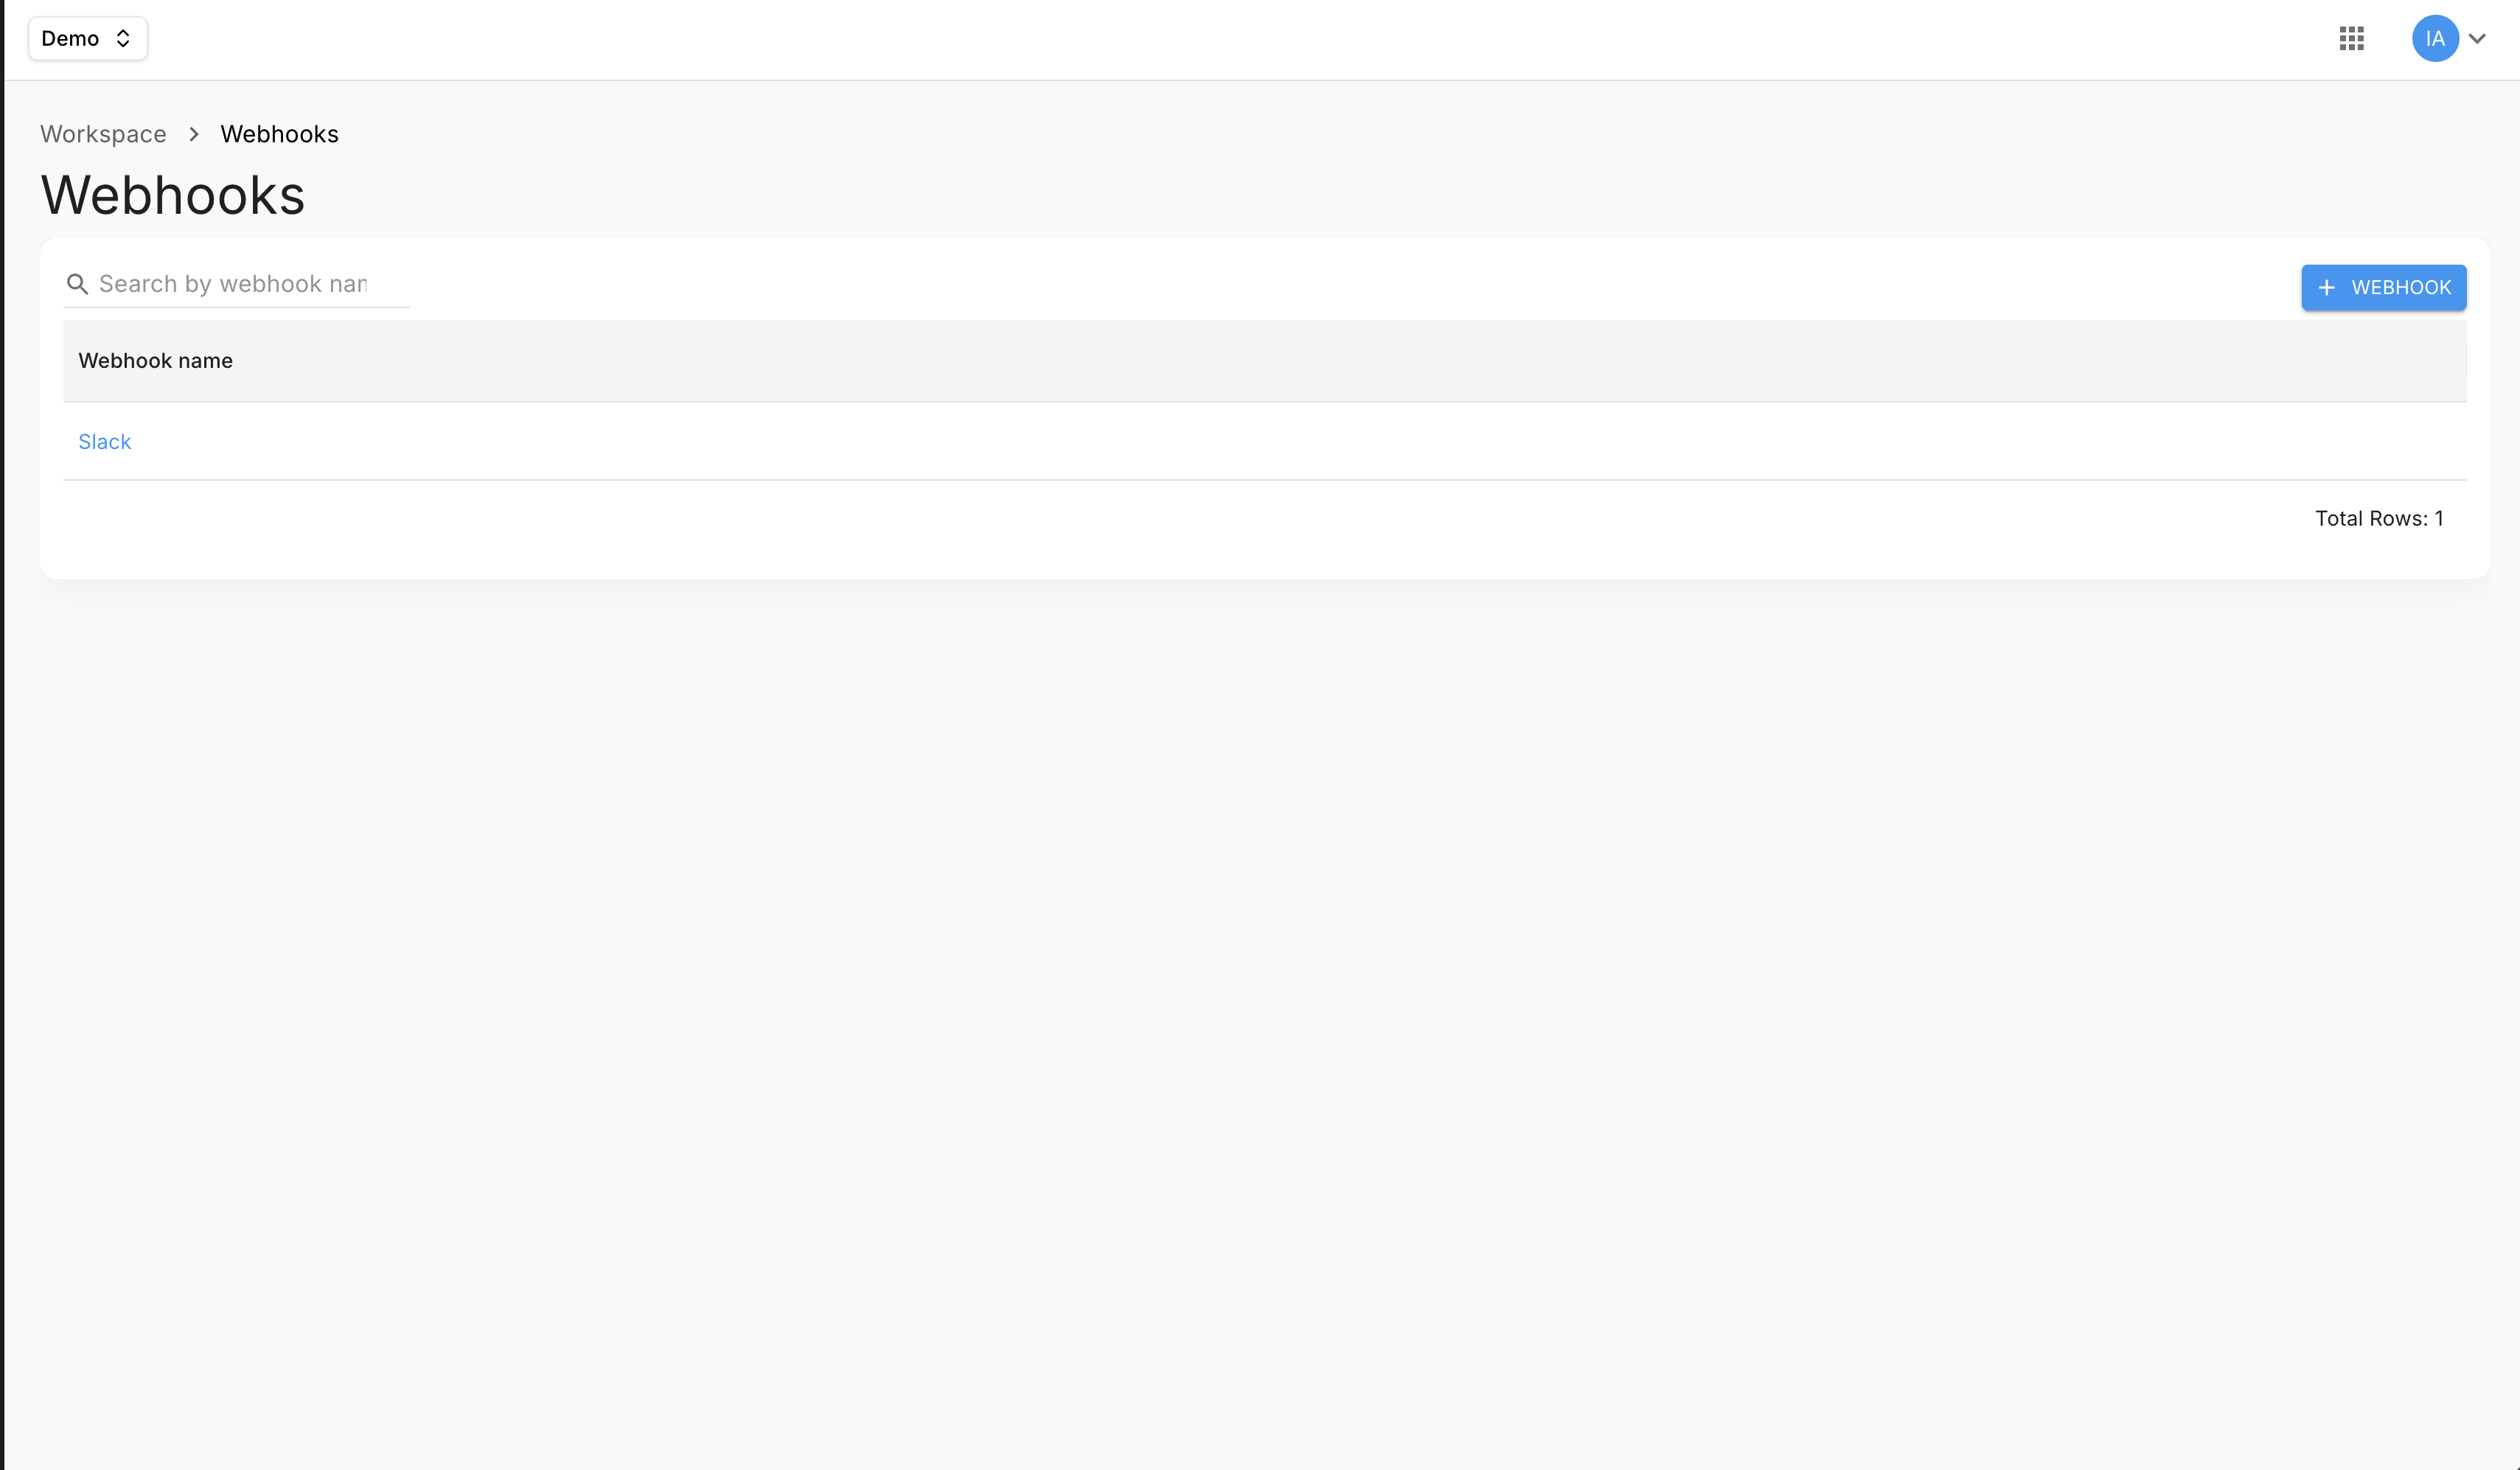
Configure outbound webhooks at /workspaces/:id/webhooks. Accessible via avatar dropdown → Webhooks. Use these to push policy alerts and compliance events to external systems (Slack, PagerDuty, SIEM tools, etc.).
Workspace Dashboard
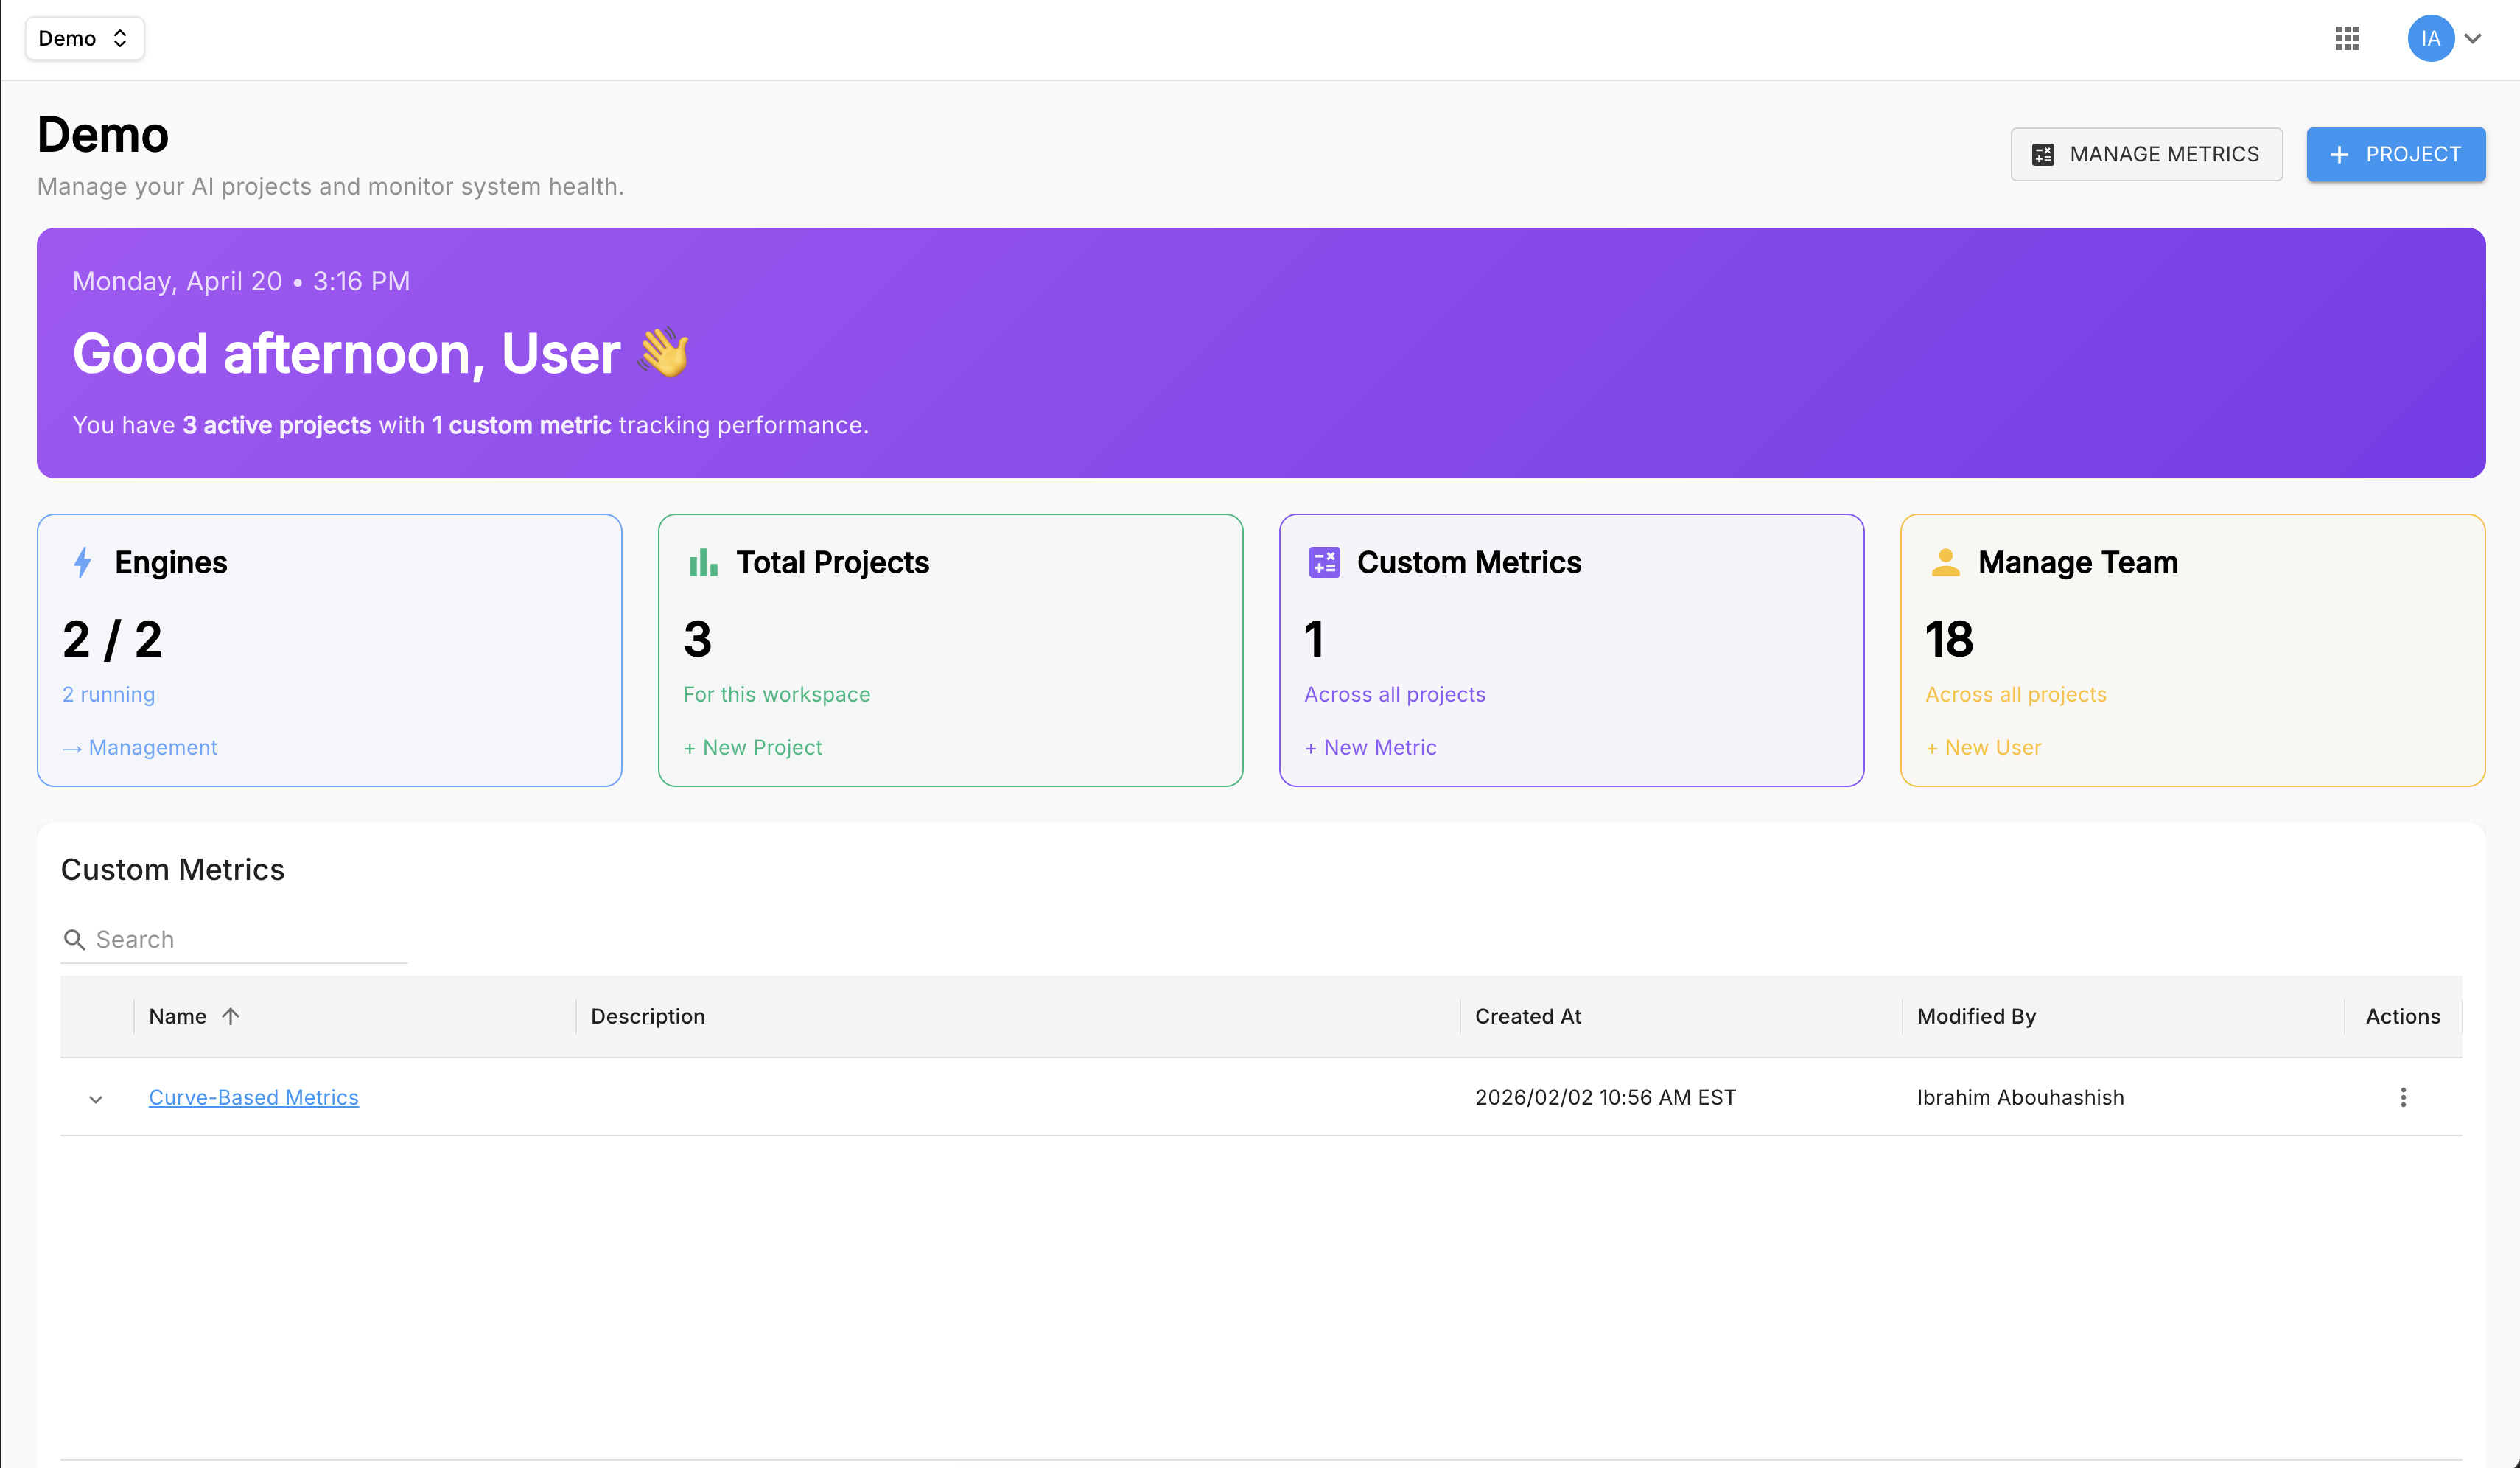
The Workspace Dashboard is your organization-wide home view, located at /workspaces/:id. Navigate here by clicking Home in the left sidebar.
What you see at the workspace level
The workspace home displays stats cards at the top:
| Card | What it shows |
|---|---|
| Engines | Active and total connected engines |
| Total Projects | Number of projects in this workspace |
| Custom Mertics | Number of custom metrics defined |
| Team Members | Total workspace members |
Below the cards, a Custom Metrics table lists all workspace-level custom metrics. From this page you can also click + New Project to create a project or Manage Metrics to navigate to /workspaces/:id/custom-aggregations.
Workspace-level navigation pattern
flowchart LR
    Home["Home Screen"] --> WD["Workspace Dashboard"]
    WD --> PA["Project Analytics<br/>(select a project)"]
    WD --> AD["Discovery (Governance)"]
    WD --> Gov["Governance Overview"]
    PA --> App["Application Detail"]
Use the workspace home as your daily starting point. Check the stats cards for a health snapshot, then navigate to Applications for Application-level dashboards, Analytics for workspace and project-level dashboards, or Governance for policy compliance across all applications.
Project Analytics
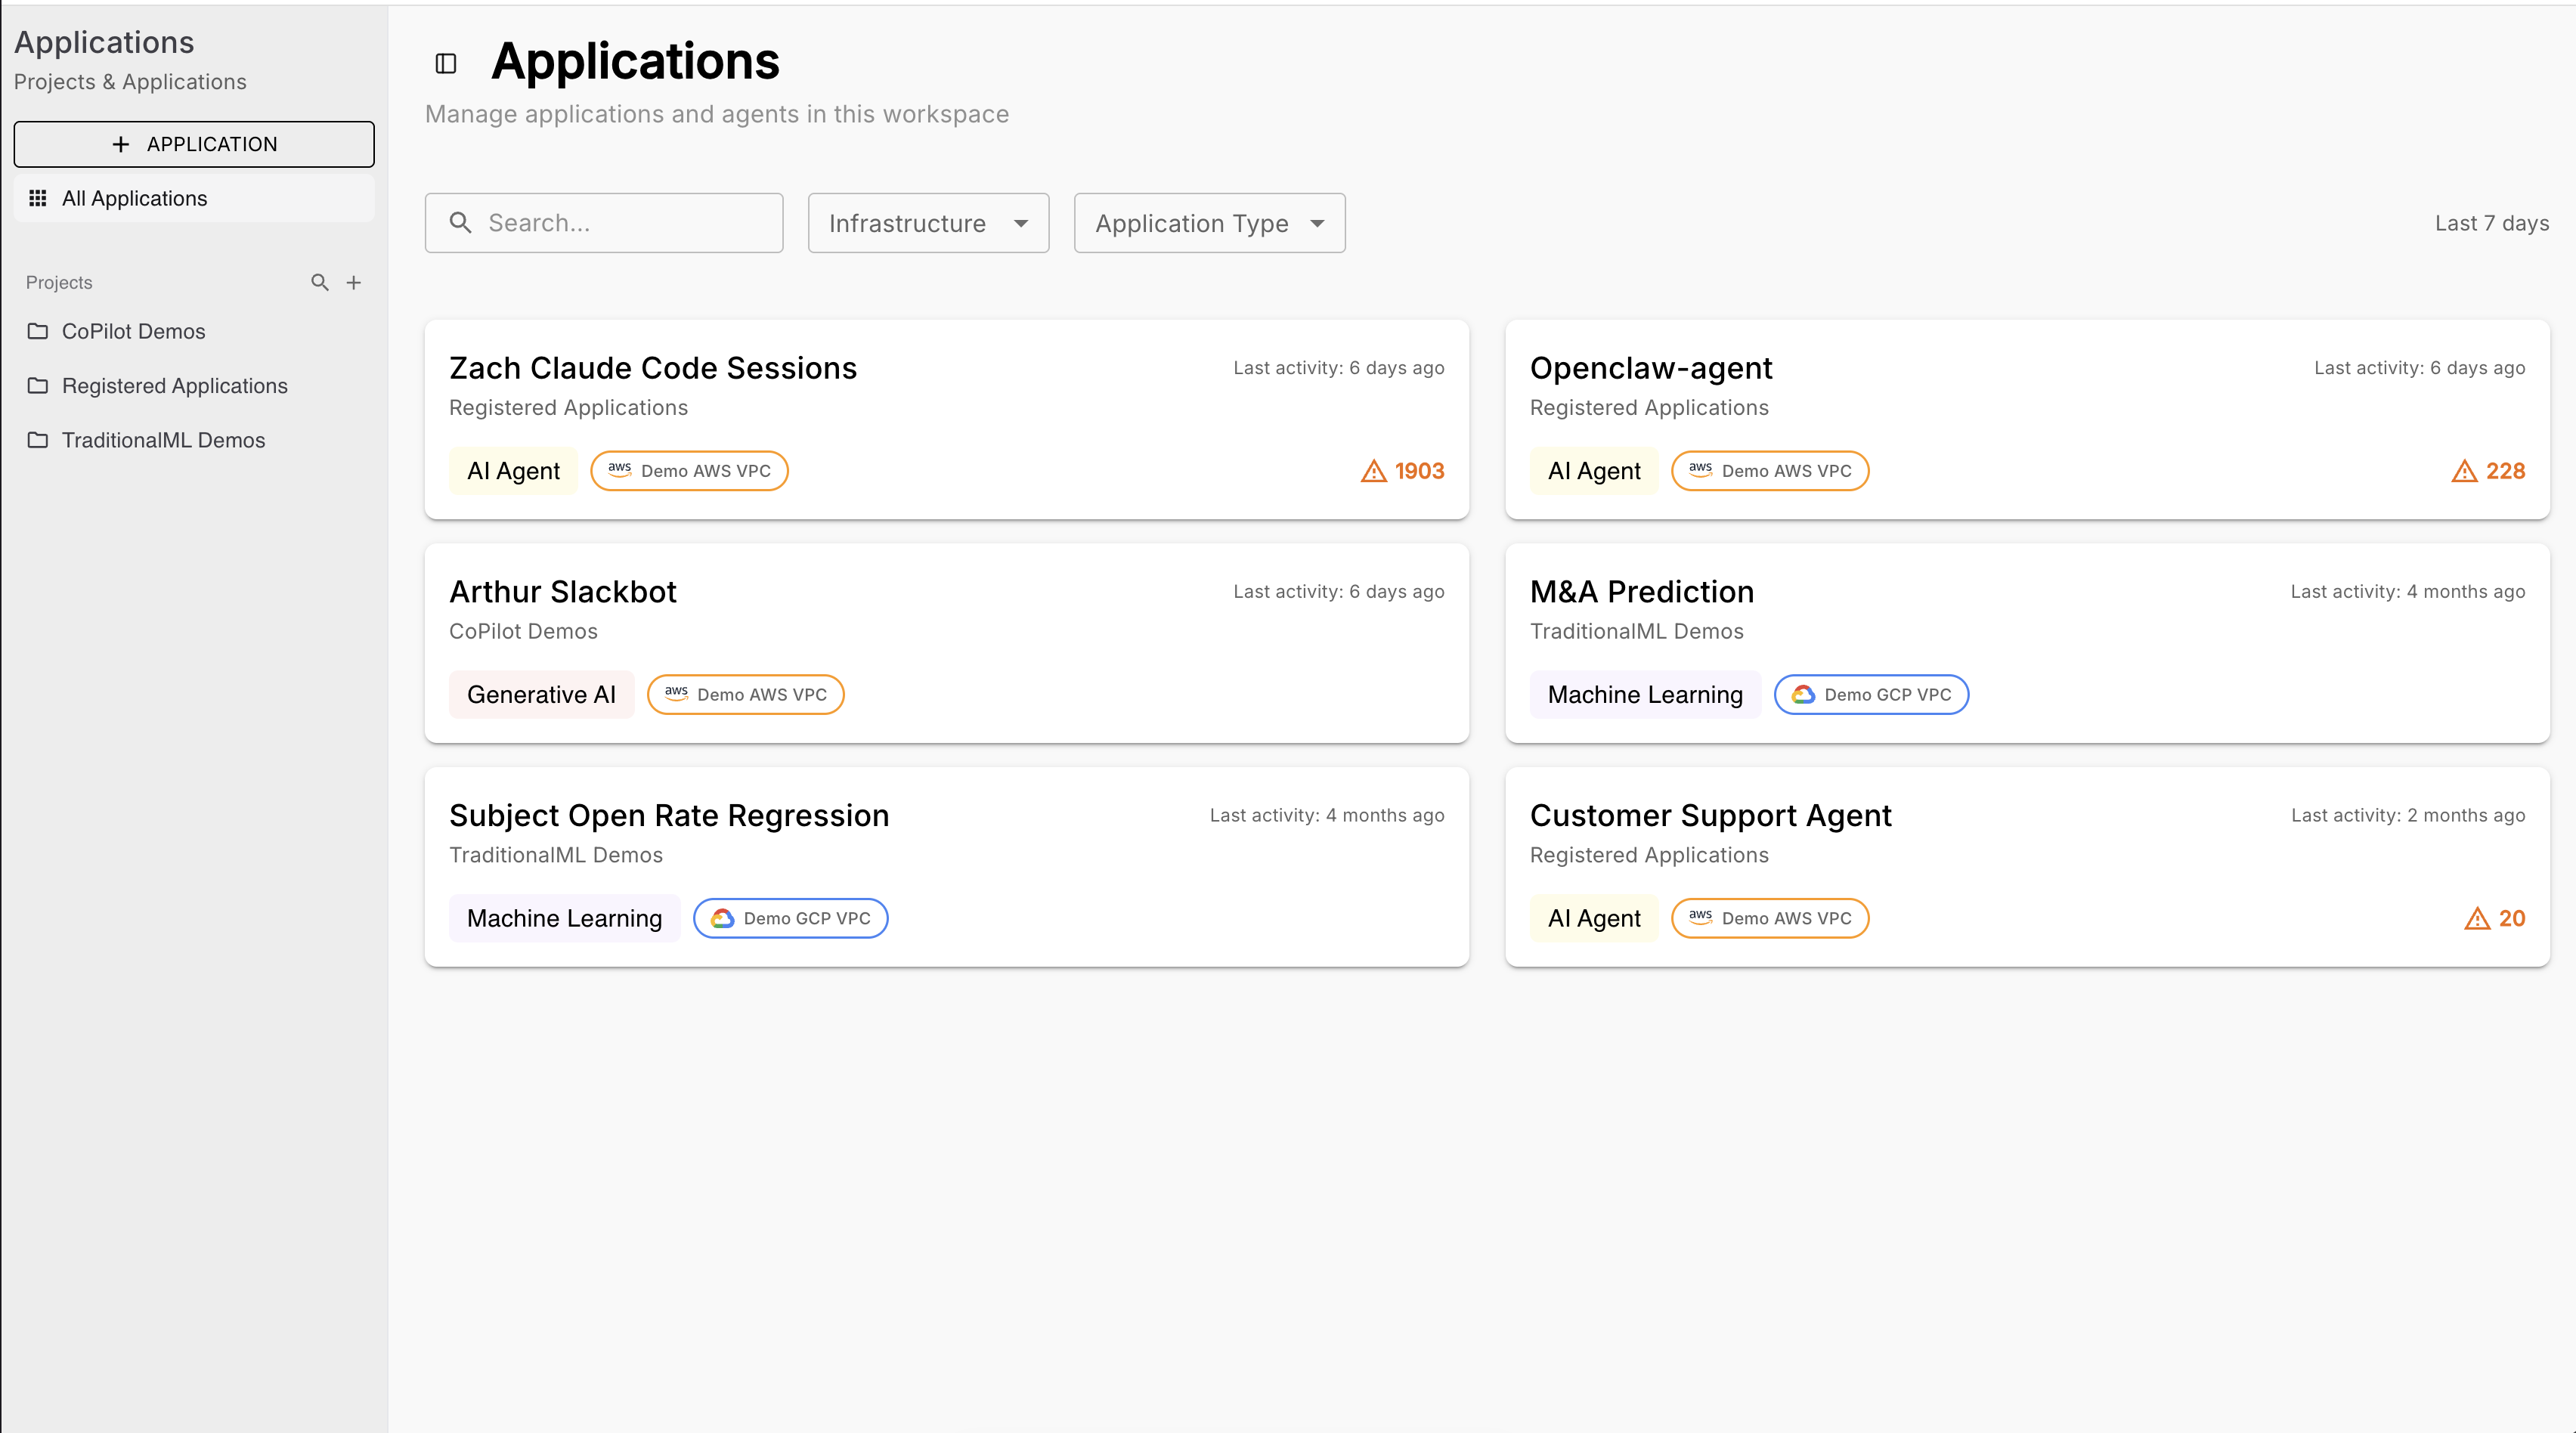
Applications view
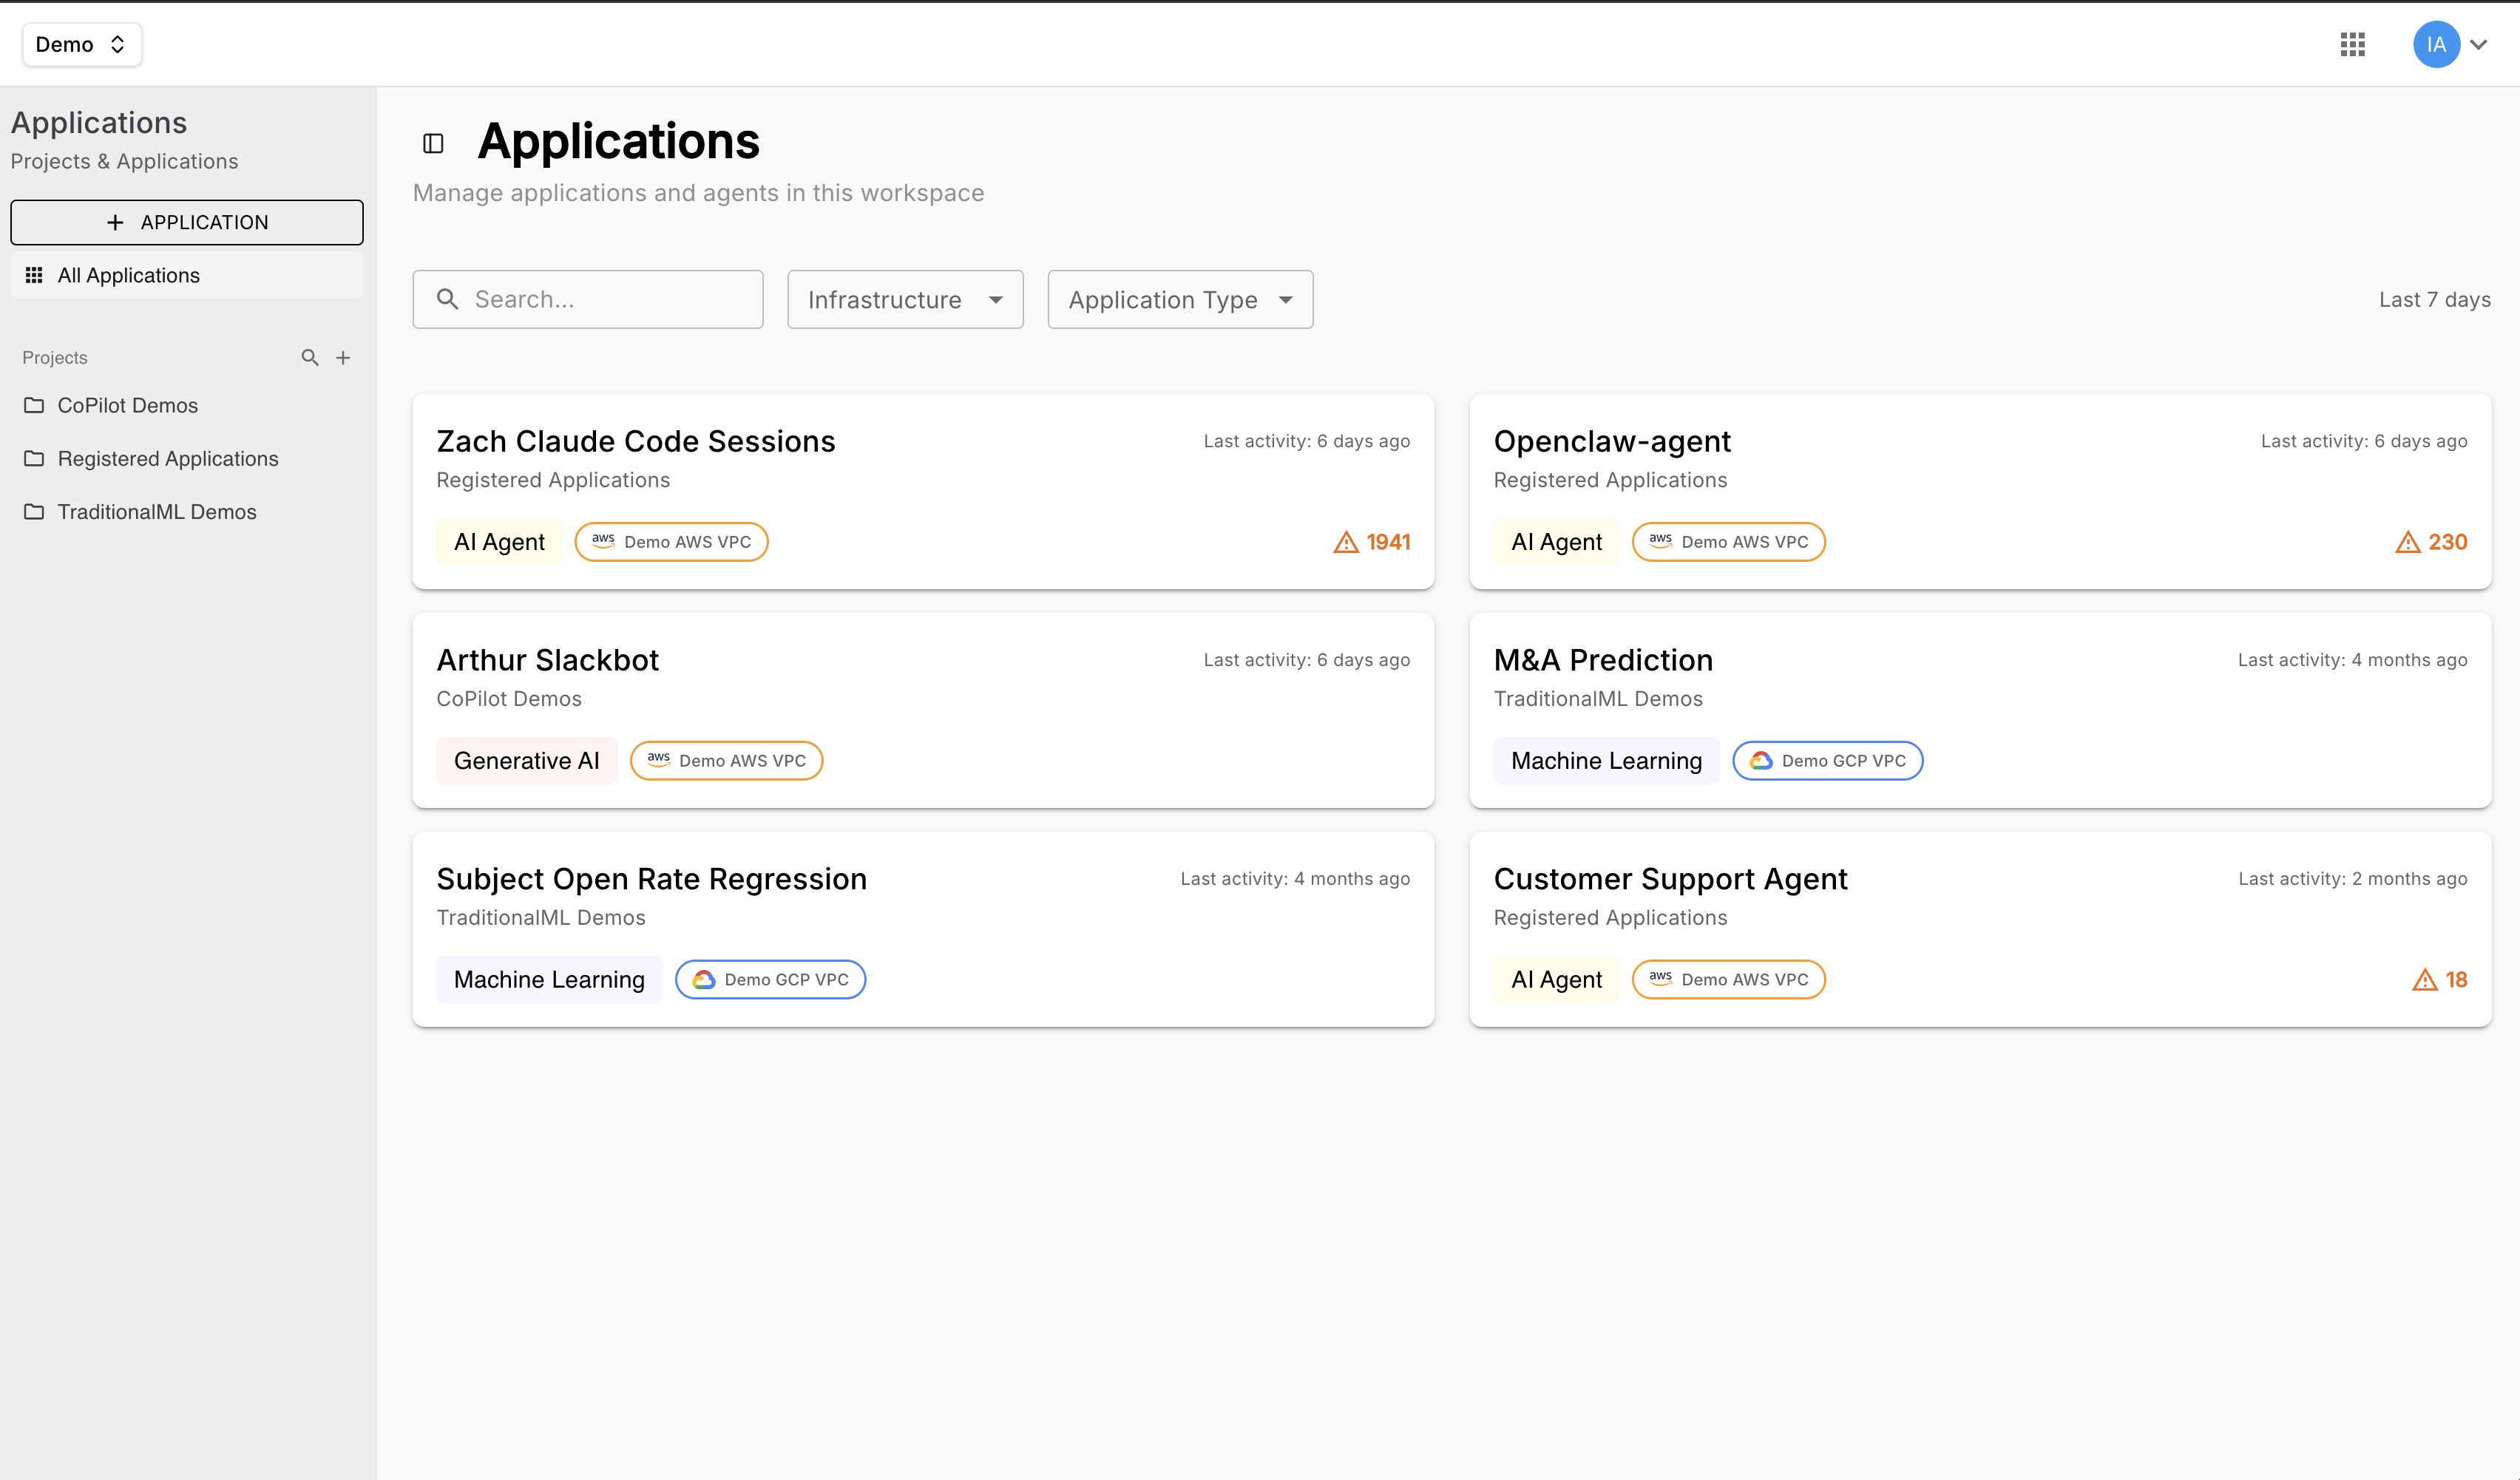
The Applications view (/workspaces/:id/applications) shows all applications in the workspace as a card grid. Each card displays:
- Application name and project
- Type badge: AI Agent, Generative AI, or Machine Learning
- Infrastructure tag (e.g. AWS VPC, GCP VPC)
- Last activity timestamp
- Alert count (if any)
Projects are listed in the left sub-nav. Clicking a project filters the grid to that project's applications only. The + APPLICATION button in the left sub-nav opens the application creation flow.
Project analytics dashboard
The Project Dashboard (/analytics/project-dashboard) is scoped to a single project. Use the project selector dropdown to switch projects and the Local Time Selector to set the time window.
In addition to the default dashboards, users can create Custom Dashboards from the Analytics sub-nav (+ button). Custom dashboards are listed under the built-in ones and can be shared across the workspace.
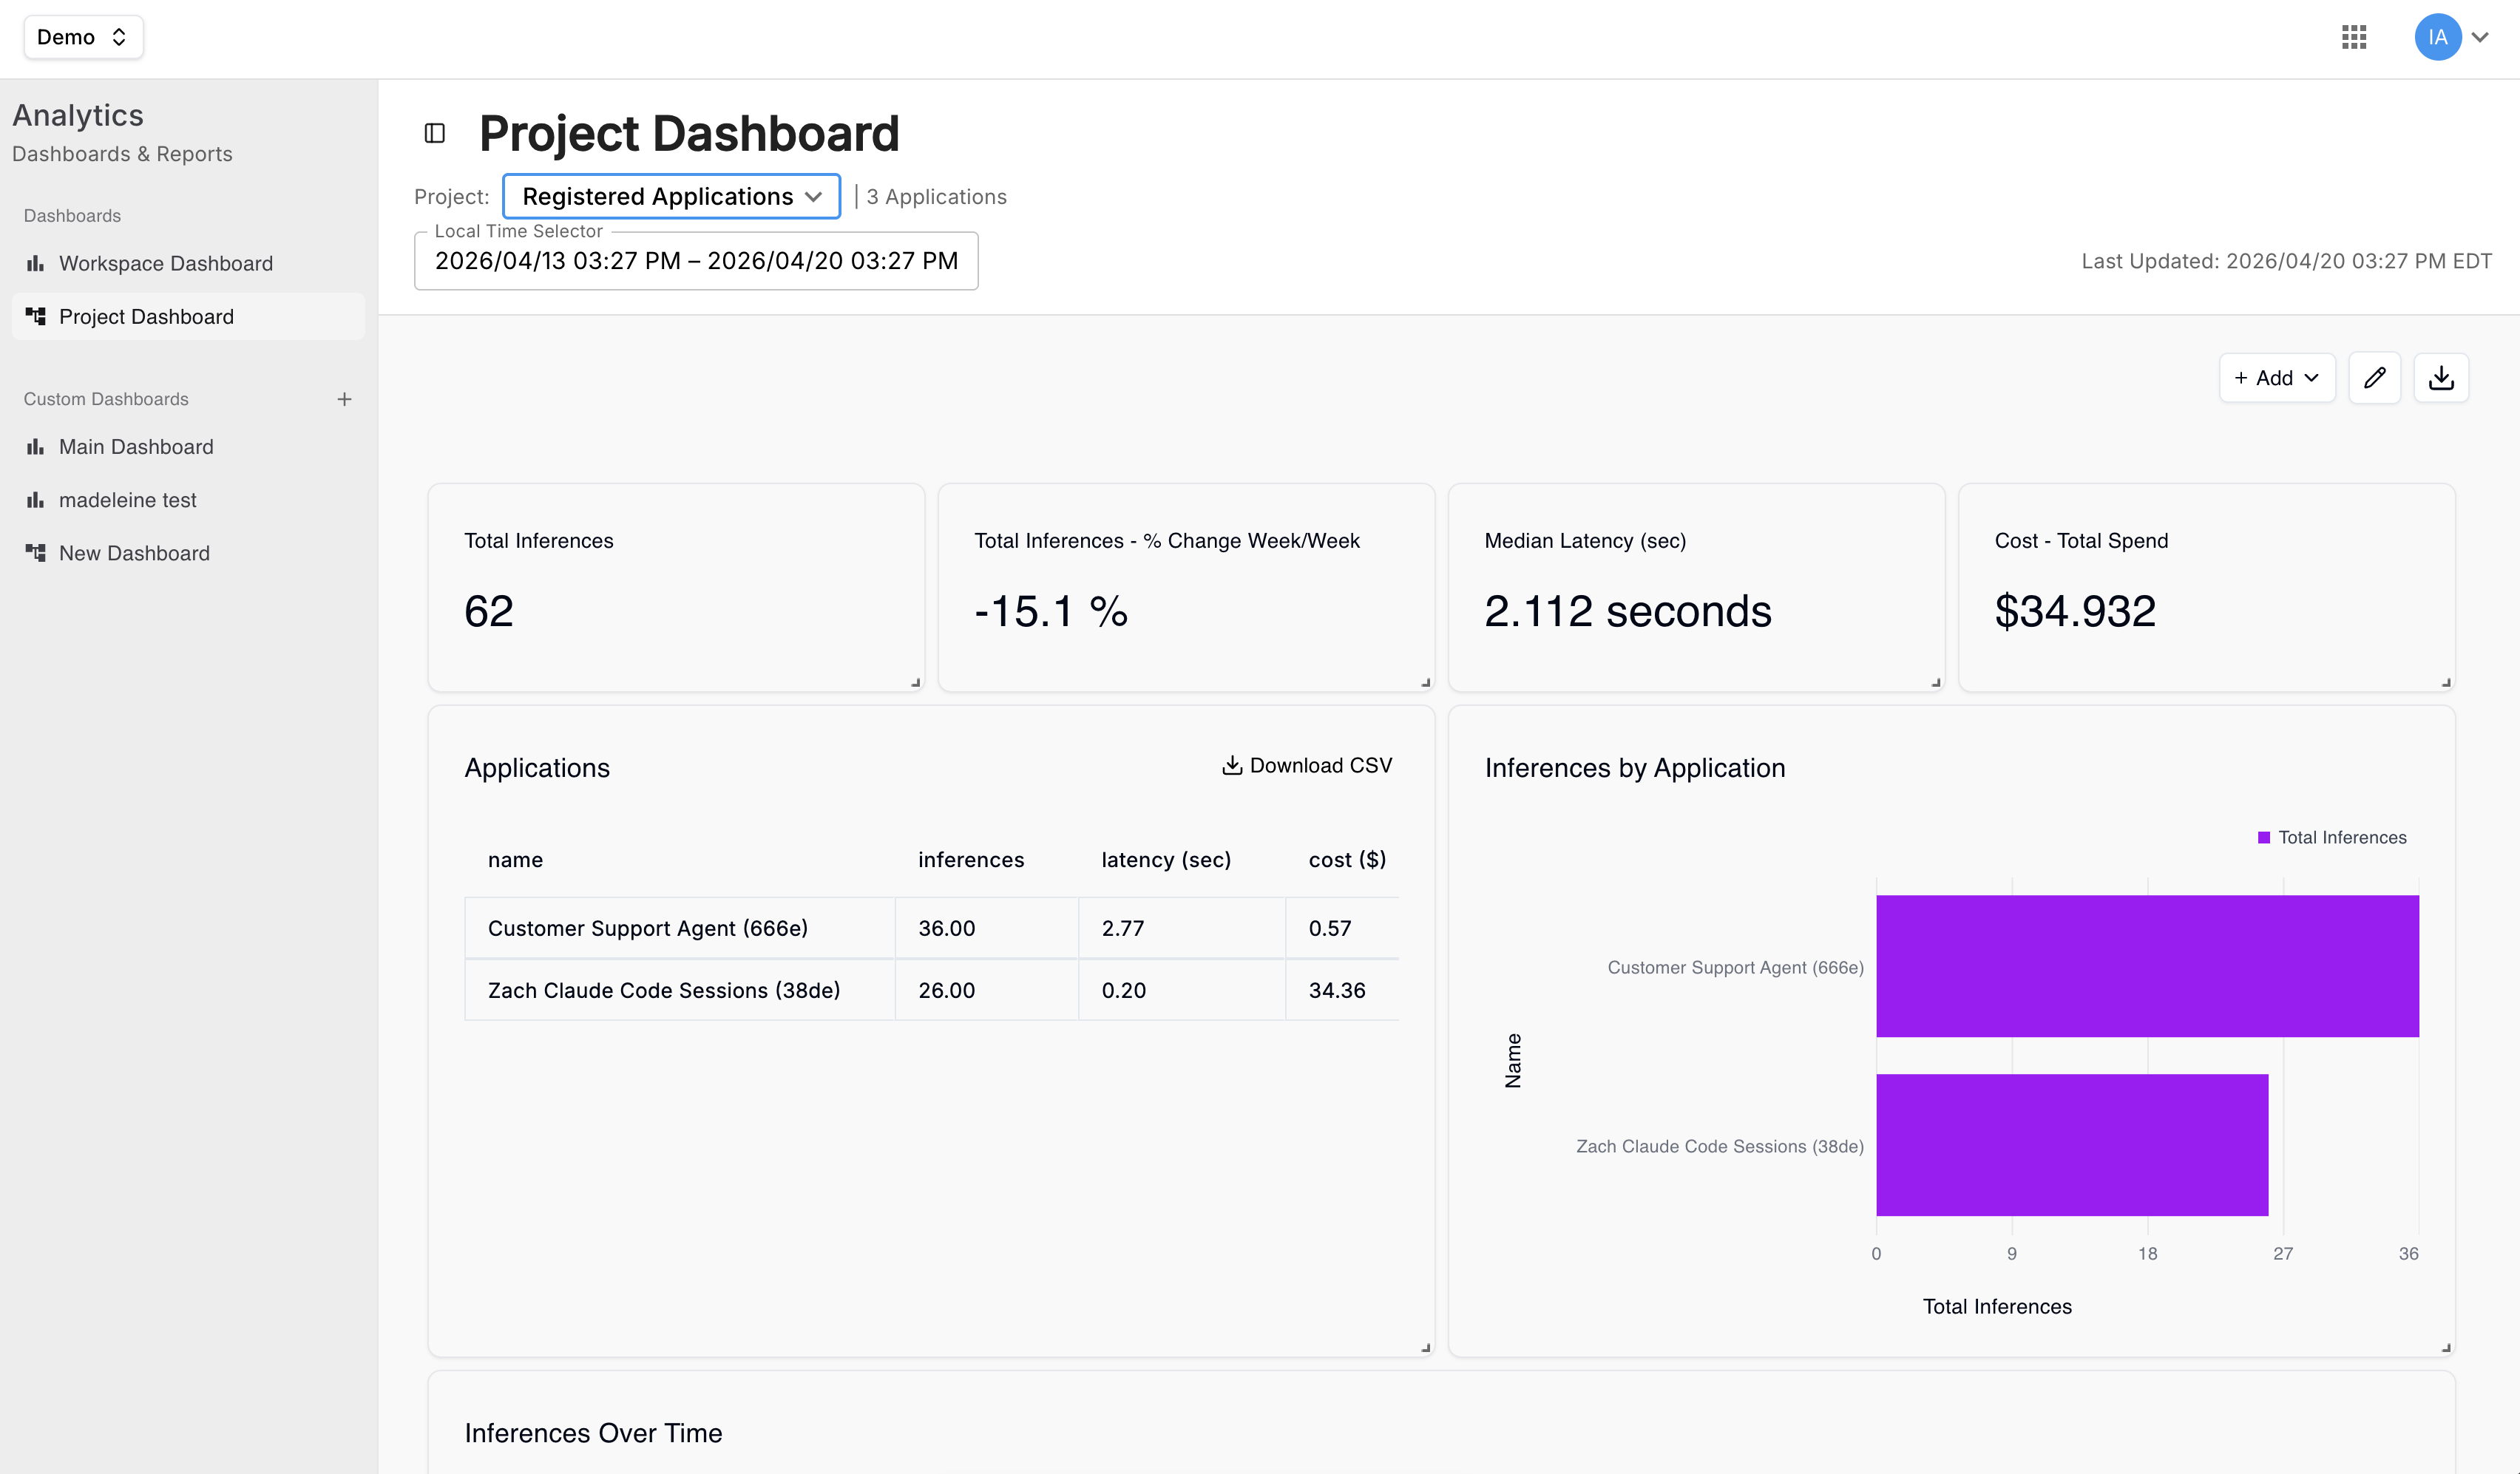
Tip: Use the Local Time Selector to compare performance across periods — useful after a model update or prompt change.
Application Detail
The Application Detail view is where you do your deepest investigation. Navigate here by clicking any application name from the project analytics view or the workspace applications list.
Application detail sections
The tabs available on an application detail page depend on the application type:
| Tab | Traditional ML | Agentic | Gen AI |
|---|---|---|---|
| Dashboard | ✅ | ✅ | ✅ |
| Overview | ✅ | ✅ | ✅ |
| Inference Deep-Dive | ✅ | — | ✅ |
| Evals | — | ✅ | — |
| Guardrails | — | ✅ | ✅ |
| Alerts | ✅ | ✅ | ✅ |
| Activity Logs | ✅ | ✅ | ✅ |
| Chat Playground | — | — | ✅ |
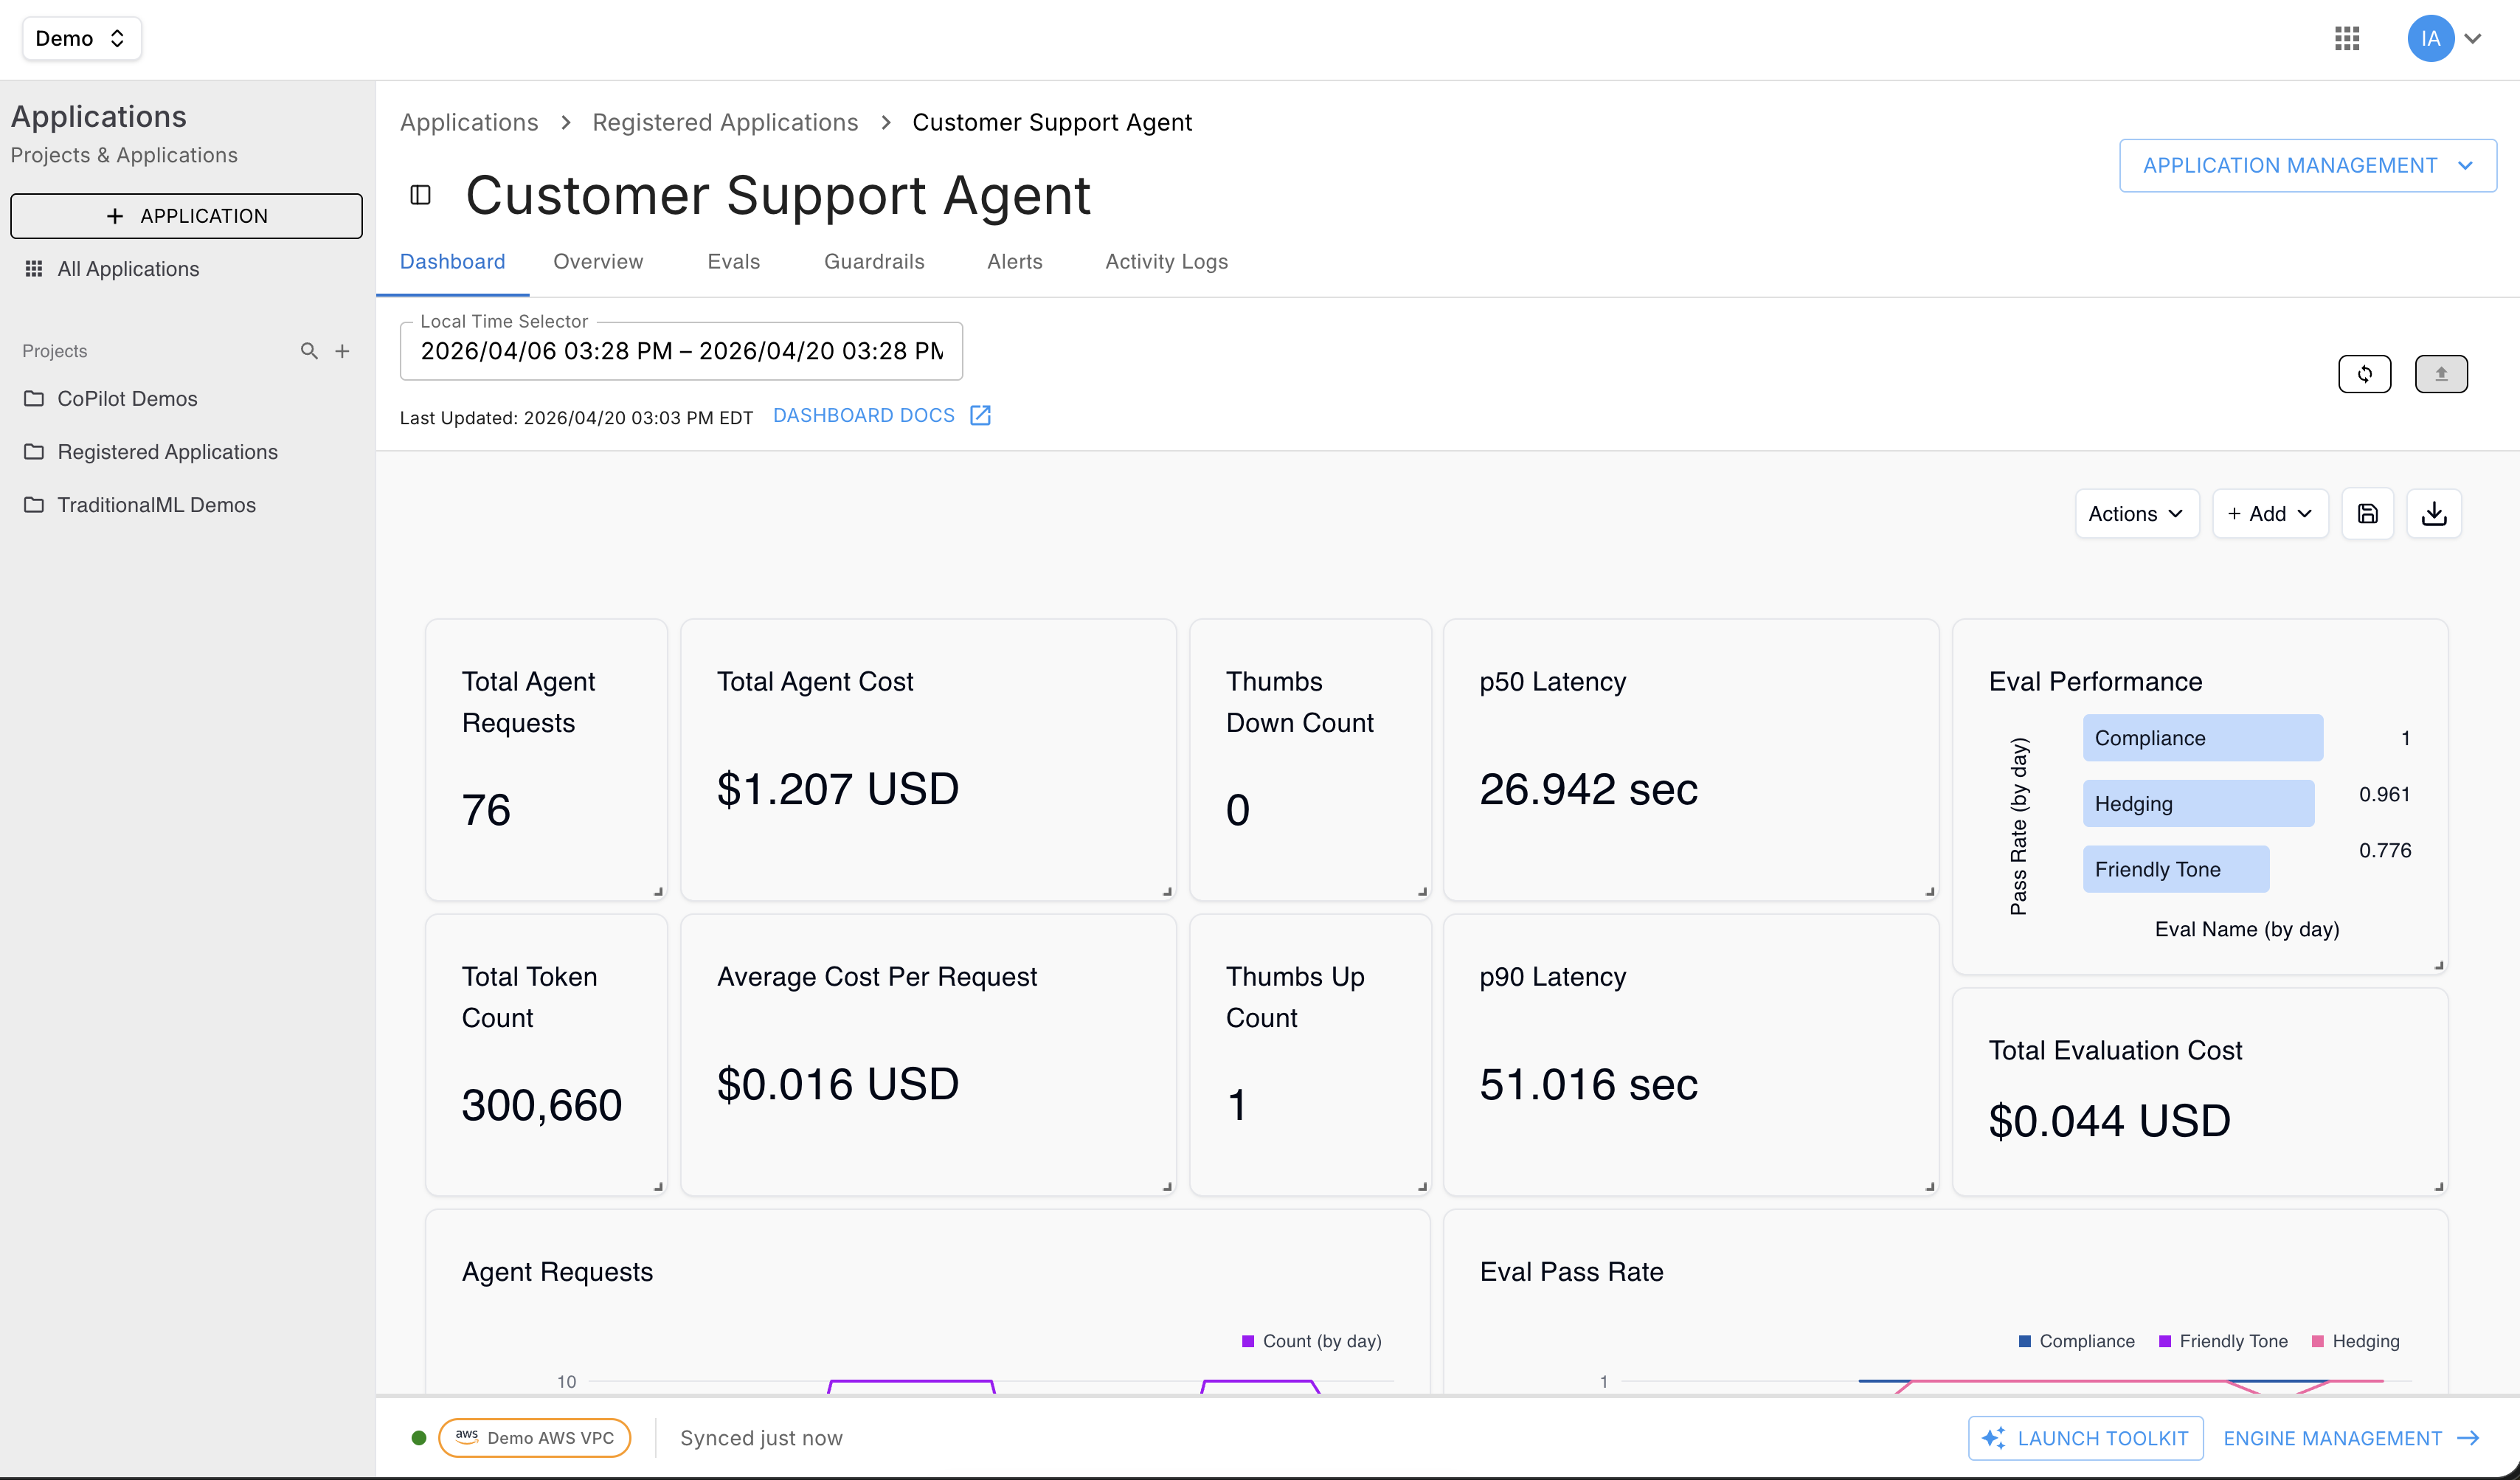
Dashboard tab
High-level health indicators for this application: request volume, error rate, average latency, and active alerts.
Overview tab
Application metadata and composition. Shows Description, Created At, Last Active, and Last Updated By at the top, followed by expandable sections:
- Policies — policies applied to this application
- Agents — agents detected within the application
- Tools — tools the application uses
- Models — models registered to the application
- Connected Data Sources — external data sources connected to the application
Inference Deep-Dive
Available on all application types, but the view differs:
Traditional ML and GenAI — a tabular browser of individual inference records with a Dataset Name Selector dropdown, Time and Date Range picker, and Columns/Filters controls. Each row represents one inference showing feature values and ground truth; click > to expand for full detail.
Agentic Trace — a span-level detail view. Click any trace to open a drawer showing:
- Input and output at each step
- Duration and latency per span
- Tool selection and tool usage metrics with reasoning
- Relevance scores (query relevance, response relevance)
Evals (Agentic Trace only)
Evaluation results for the application's traced outputs.
Guardrails (Agentic Trace and GenAI only)
Guardrail rule configuration and violation history for this application.
Alerts
Alert rules and recent alert history scoped to this application.
Trace drill-down workflow
sequenceDiagram
    participant U as You
    participant AL as Application List
    participant AD as Application Detail
    participant TL as Trace List
    participant TS as Trace Span View

    U->>AL: Click application name
    AL->>AD: Load application overview
    U->>AD: Click "Traces" tab
    AD->>TL: Show paginated trace list
    U->>TL: Filter by time / status / tag
    TL->>TL: Narrow results
    U->>TL: Click a specific trace
    TL->>TS: Open span waterfall
    U->>TS: Inspect inputs, outputs, latency, policy results
Custom Aggregations
If the built-in metrics don't cover your use case, Arthur lets you define custom aggregations over your trace data.
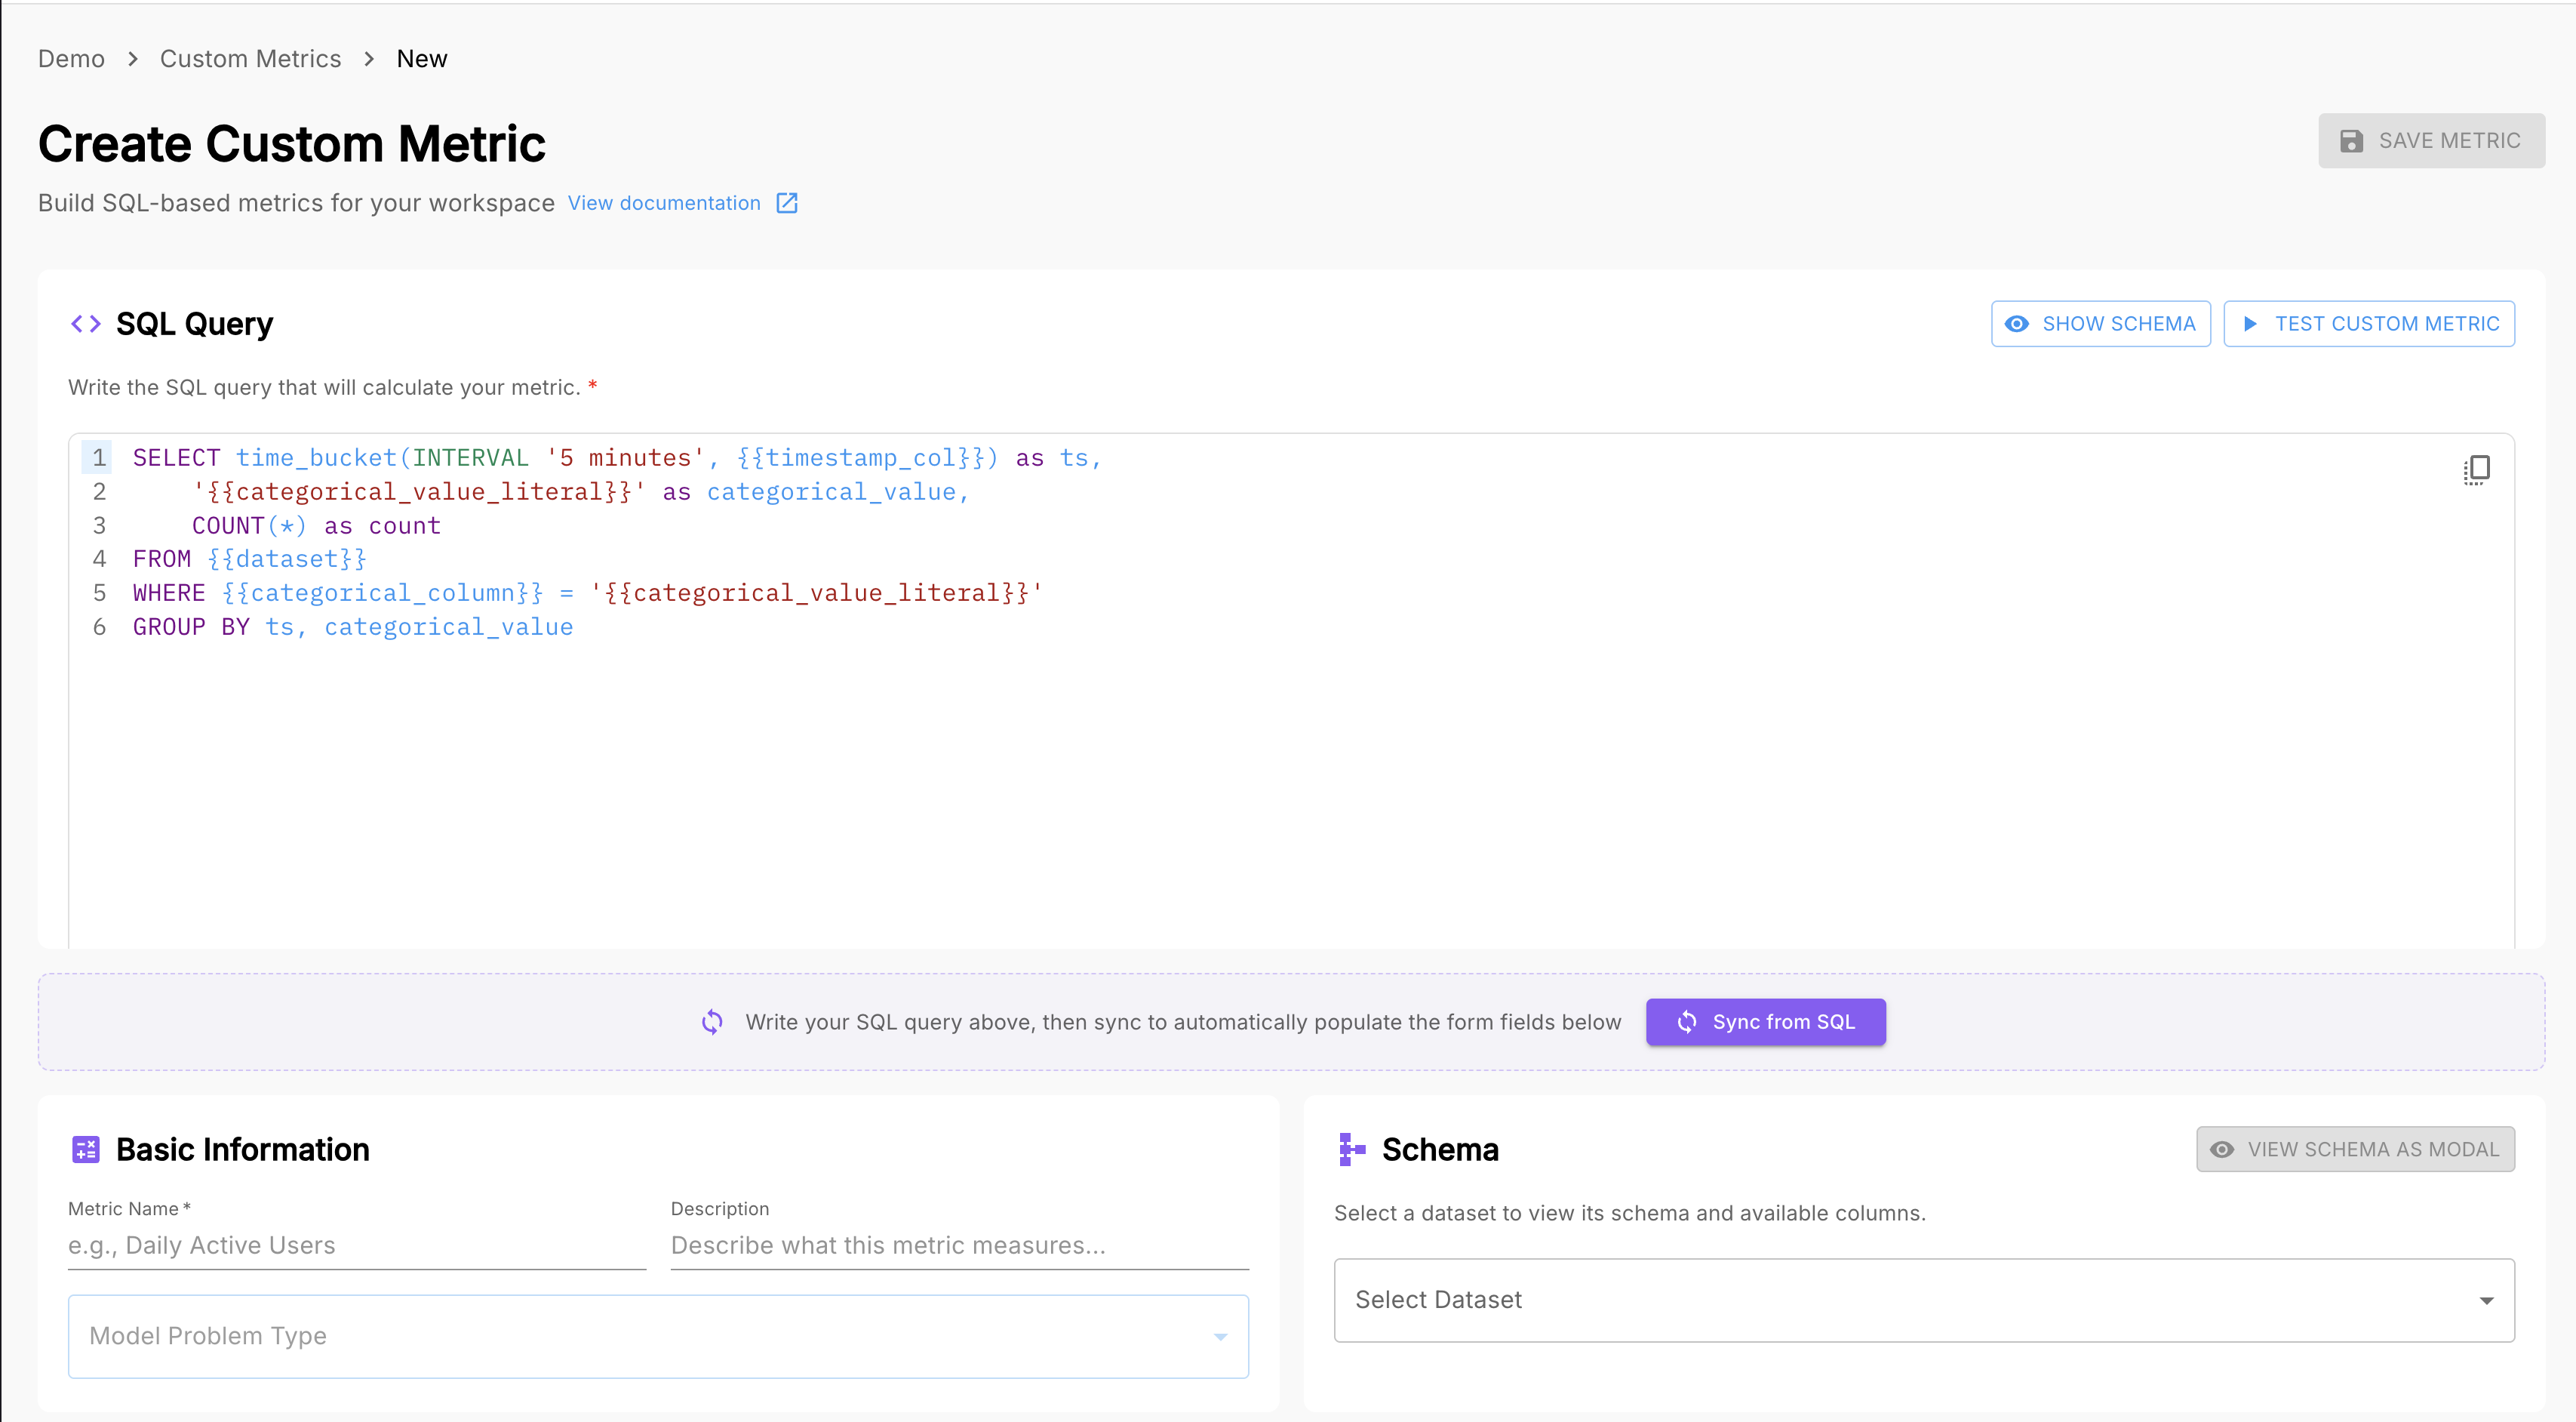
Navigate to Application Detail → Metrics → + New Custom Aggregation to define a metric using filters, grouping, and aggregation functions (sum, average, percentile, count).
Next Steps
Now that you understand the dashboard hierarchy and can navigate from workspace health down to individual trace spans, here's where to go next:
| Goal | Where to Go |
|---|---|
| Set up alerting | Policies & Alert Rules — create policies with alert rules that fire when metrics breach thresholds |
| Govern your agents | Agent Discovery & Governance — register discovered agents and apply governance policies |
| Integrate your application | SDK Quickstart — instrument your AI application to start sending traces to Arthur |
| Manage team access | IAM & User Management — configure roles and groups for your workspace |
| Define custom metrics | Custom Metrics — build aggregations tailored to your application's behavior |
| Export data | Webhooks & Integrations — push Arthur events to your existing observability stack |
Summary: Arthur's observability interface flows from Workspace → Project → Application. Start at the workspace dashboard for a health overview, drill into a project when you spot anomalies, and use the application detail view — especially the trace waterfall — for root-cause investigation. Every metric you see at the workspace level is a rollup of what's happening at the application level, so the hierarchy always gives you a clear path from symptom to cause.
Updated 2 months ago