Metrics Versioning
Overview
Arthur supports two related but distinct versioning concepts:
-
Tracking metrics by application version — segment a metric by a version identifier (e.g.,
prompt_version_id) so your dashboard shows separate lines per version. This is the primary use case when you want to compare prompt versions, model versions, or any categorical dimension over time. -
Metric computation versions — each time Arthur recalculates metrics, it creates a new internal version snapshot. The
_latest_versionviews always surface the most recent computation automatically.
Tracking Metrics by Application Version
How It Works
When you configure a metric, you specify one or more Segmentation Columns — fields in your inference data (e.g., prompt_version_id, model_version, environment) that Arthur stores in the dimensions JSONB column alongside each metric row.
Once stored, you can group or filter by those dimensions in any chart SQL query — producing separate series per version.
The result looks like this:
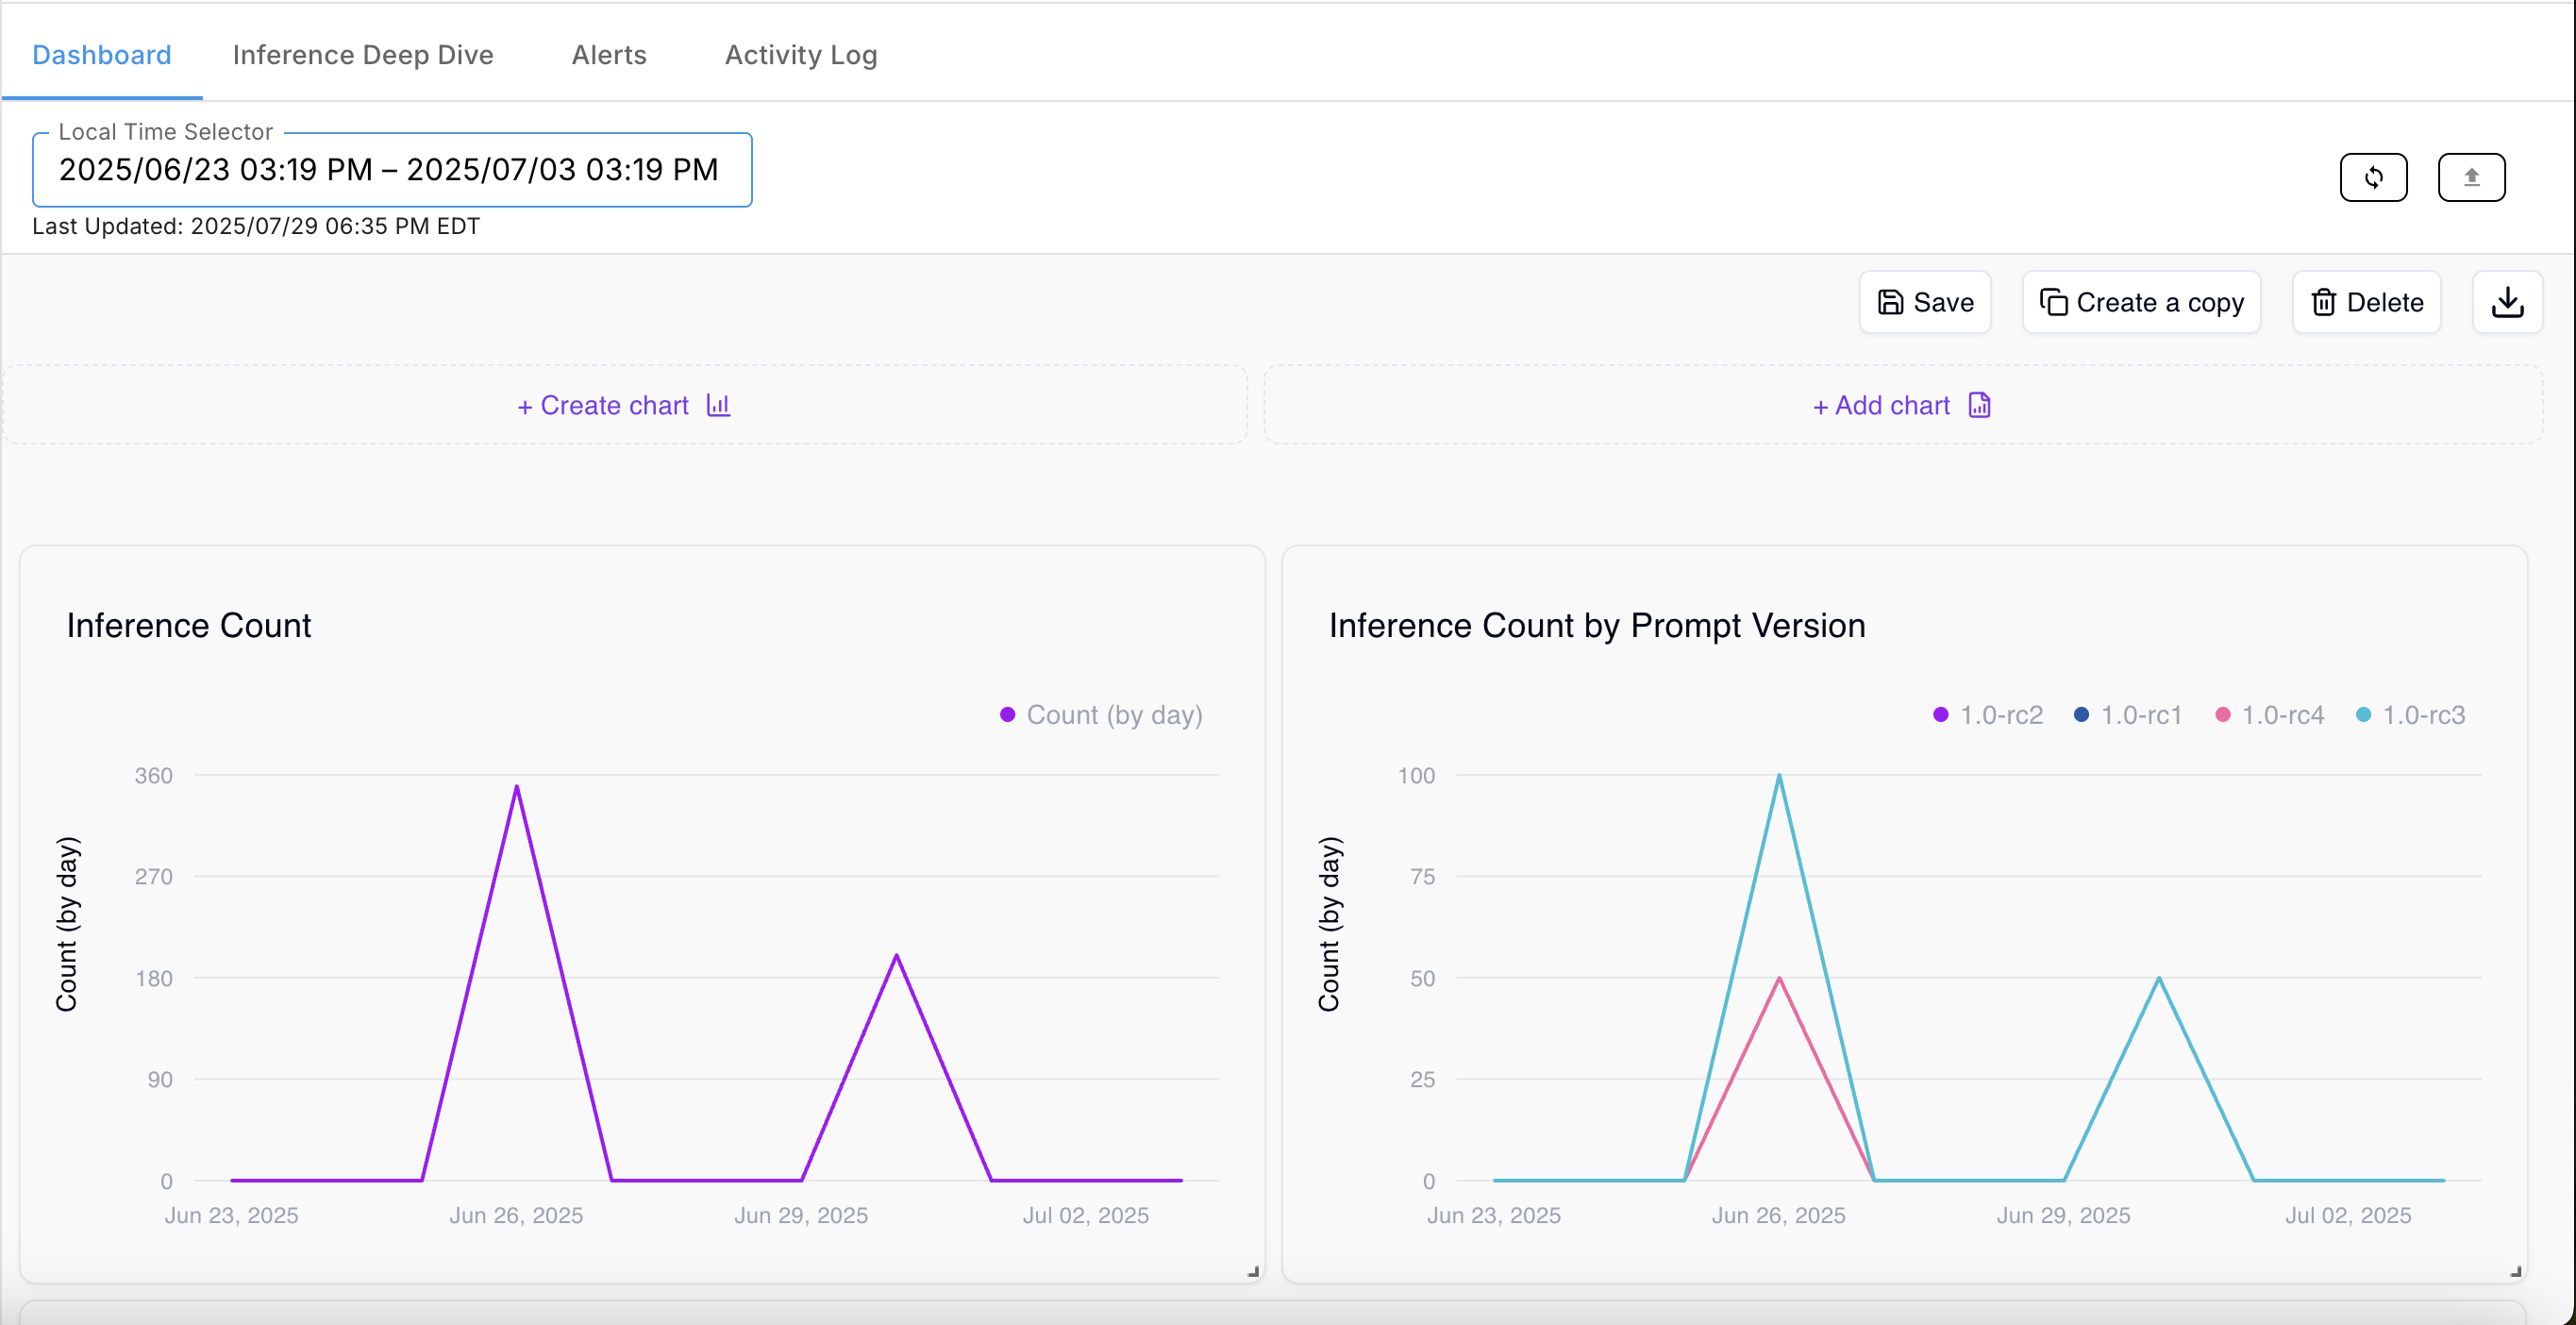
The Inference Count by Prompt Version chart shows a separate line for each value of prompt_version_id (1.0-rc1, 1.0-rc2, 1.0-rc3, 1.0-rc4) — with no additional SQL complexity beyond GROUP BY dimensions->>'prompt_version_id'.
Step 1 — Configure a Segmentation Column
When setting up a metric's configuration, add the version identifier field as a Segmentation Column:
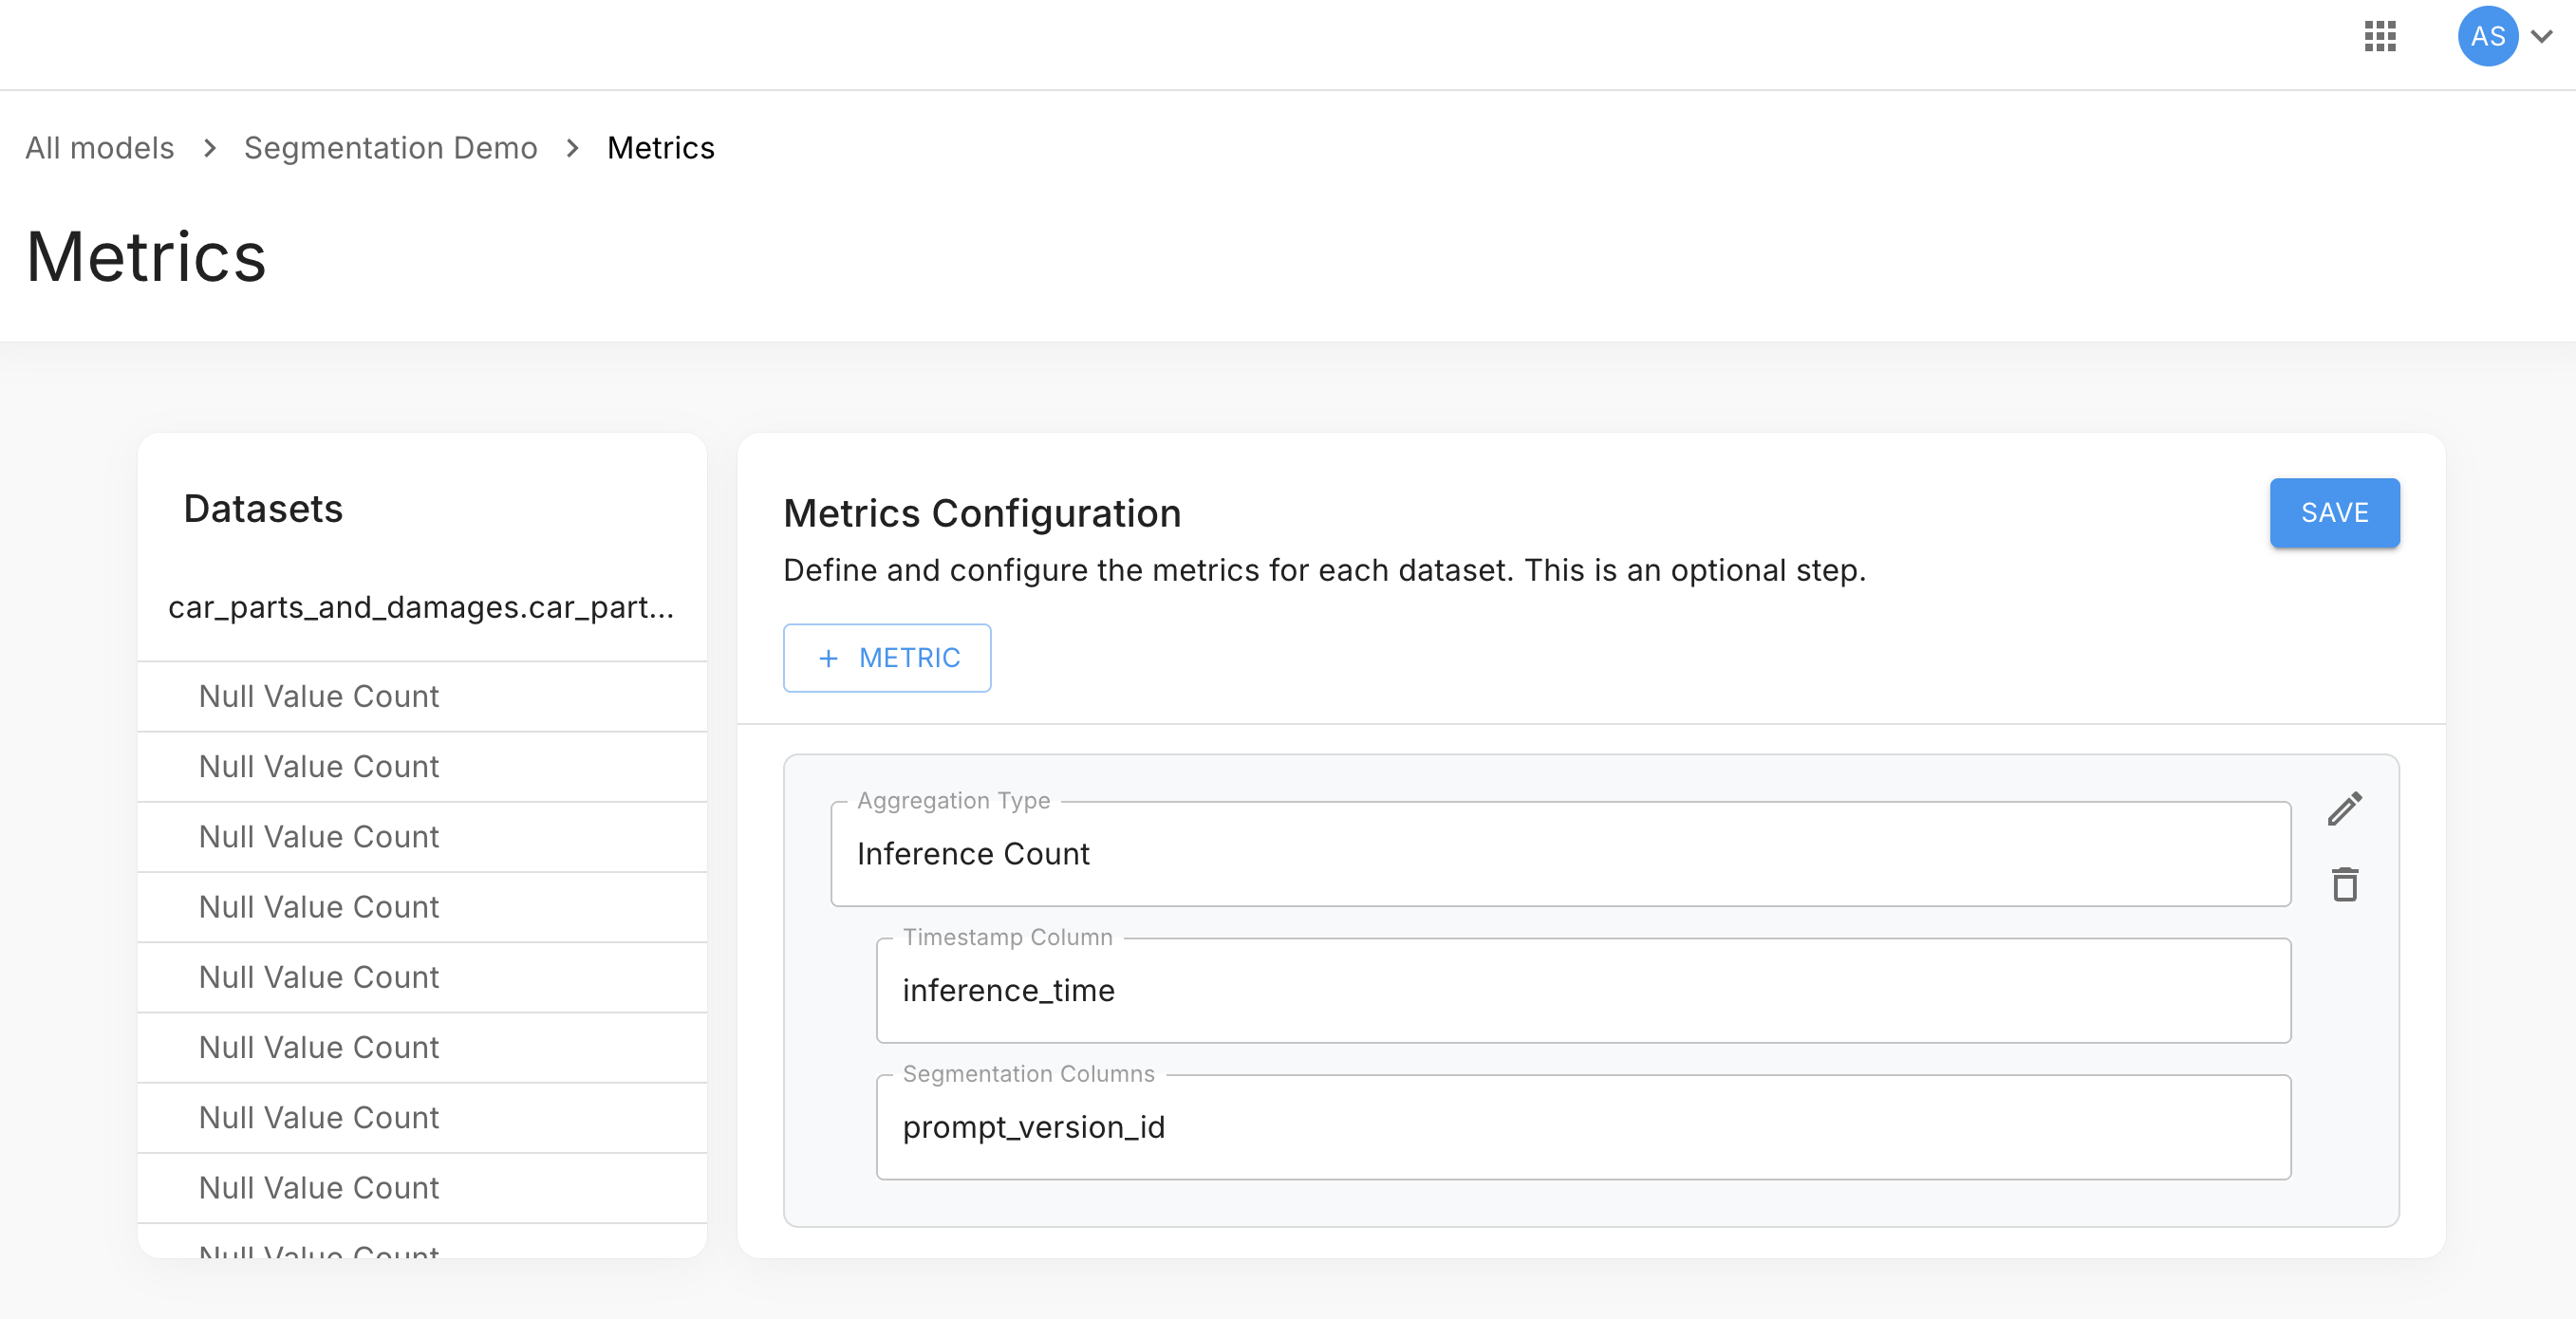
| Field | Example value | Description |
|---|---|---|
| Aggregation Type | Inference Count | The metric to compute |
| Timestamp Column | inference_time | The field used as the metric timestamp |
| Segmentation Columns | prompt_version_id | The field(s) Arthur stores in dimensions for grouping |
You can add multiple segmentation columns. Each becomes a key in the dimensions JSONB object — queryable as dimensions->>'column_name'.
Step 2 — Query by Version Dimension
Once the segmentation column is configured, use the ->> operator to group or filter by it:
Inference count broken down by prompt version:
SELECT
  time_bucket('1 day', timestamp)     AS bucket,
  dimensions->>'prompt_version_id'    AS prompt_version,
  SUM(value)                           AS count
FROM metrics_numeric_latest_version
WHERE metric_name = 'inference_count'
  [[ AND timestamp BETWEEN '{{dateStart}}' AND '{{dateEnd}}' ]]
GROUP BY bucket, prompt_version
ORDER BY bucket, prompt_version;
Filter to a specific version:
SELECT
  time_bucket('1 day', timestamp) AS bucket,
  SUM(value) AS count
FROM metrics_numeric_latest_version
WHERE metric_name  = 'inference_count'
  AND dimensions->>'prompt_version_id' = '1.0-rc2'
  [[ AND timestamp BETWEEN '{{dateStart}}' AND '{{dateEnd}}' ]]
GROUP BY bucket
ORDER BY bucket;
Compare two versions side by side:
SELECT
  time_bucket('1 day', timestamp)                                                     AS bucket,
  SUM(value) FILTER (WHERE dimensions->>'prompt_version_id' = '1.0-rc1')             AS rc1_count,
  SUM(value) FILTER (WHERE dimensions->>'prompt_version_id' = '1.0-rc2')             AS rc2_count
FROM metrics_numeric_latest_version
WHERE metric_name = 'inference_count'
  AND dimensions->>'prompt_version_id' IN ('1.0-rc1', '1.0-rc2')
  [[ AND timestamp BETWEEN '{{dateStart}}' AND '{{dateEnd}}' ]]
GROUP BY bucket
ORDER BY bucket;
Building the Chart
In the Create chart builder:
- Write a query that includes the version dimension column in your
SELECT(e.g.,dimensions->>'prompt_version_id' AS prompt_version). - Set X Axis to your time bucket column.
- Set Y Axis to your value column.
- Click + Segment data under the Y Axis series and select the version column — this splits the single series into one line per version value.
Metric Computation Versions
Every time Arthur computes metrics — triggered by the dashboard Refresh button or a scheduled job — it creates a new computation version. This is independent of your application's version identifiers.
sequenceDiagram
    participant User
    participant Arthur
    participant TimescaleDB

    User->>Arthur: Refresh metrics (date range)
    Arthur->>Arthur: Queue MetricsCalculation job
    Arthur->>TimescaleDB: Write new rows with incremented version_num
    TimescaleDB->>TimescaleDB: Update max_version_for_timestamp
    Arthur->>User: Last Updated timestamp advances
Key points:
- Each refresh run increments
version_nummonotonically. - All rows written by that run share the same
version_num. - The
_latest_versionviews filter automatically to rows wheremetric_version = max_version_for_timestamp— so you always get the freshest computation by default. - Older computation versions remain queryable directly.
The metric_version Column
metric_version ColumnBoth metrics_numeric_latest_version and metrics_sketch_latest_version expose metric_version:
| Column | Type | Description |
|---|---|---|
metric_version | integer | Monotonically increasing version number. Higher = more recent computation. |
You do not need to filter on metric_version for normal dashboard queries — the _latest_version views handle it automatically.
The max_version_for_timestamp Column
max_version_for_timestamp ColumnVisible in the Preview data pane when querying raw tables. This is the internal value the _latest_version views use to filter rows:
WHERE metric_version = max_version_for_timestampDo not reference this column directly in chart queries — use the _latest_version views instead.
Listing Computation Versions via API
import requests

response = requests.get(
    f"https://your-arthur-instance.example.com/api/v1/models/{MODEL_ID}/metrics/versions",
    headers={"Authorization": f"Bearer {API_TOKEN}"},
    params={"page_size": 10, "sort": "created_at", "order": "desc"}
)

for v in response.json()["records"]:
    print(f"v{v['version_num']}  created={v['created_at']}  range={v['range_start']} → {v['range_end']}")
const response = await fetch(
`https://your-arthur-instance.example.com/api/v1/models/${MODEL_ID}/metrics/versions?page_size=10&sort=created_at&order=desc`,
{ headers: { "Authorization": `Bearer ${API_TOKEN}` } }
);
const { records } = await response.json();
records.forEach(v =>
console.log(`v${v.version_num} created=${v.created_at} range=${v.range_start} → ${v.range_end}`)
);curl "https://your-arthur-instance.example.com/api/v1/models/{model_id}/metrics/versions?page_size=10&sort=created_at&order=desc" \
-H "Authorization: Bearer your-api-token"Response structure:
{
  "records": [
    {
      "version_num": 5,
      "created_at": "2026-04-21T17:05:00Z",
      "updated_at": "2026-04-21T17:05:42Z",
      "scope_model_id": "3fa85f64-5717-4562-b3fc-2c963f66afa6",
      "range_start": "2026-04-07T00:00:00Z",
      "range_end": "2026-04-21T17:00:00Z"
    }
  ],
  "pagination": {
    "total_records": 5,
    "total_pages": 1,
    "current_page": 1,
    "page_size": 10
  }
}
Sort parameters: created_at, updated_at, range_start, range_end — with order: asc or desc (default: desc).
Querying a Specific Computation Version
SELECT
    time_bucket('1 day', timestamp) AS bucket,
    SUM(value) AS count
FROM metrics_numeric_latest_version
WHERE model_id      = '{{your-model-uuid}}'
  AND metric_name   = 'inference_count'
  AND metric_version = 3
  AND timestamp BETWEEN '{{dateStart}}' AND '{{dateEnd}}'
GROUP BY bucket
ORDER BY bucket;
Filtering onmetric_versionbypasses the "latest version" logic. Use this only when you intentionally want to compare a specific historical computation run.
When Computation Versions Are Created
| Trigger | Result |
|---|---|
| Dashboard Refresh button (manual) | New version for the selected date range |
| Scheduled refresh (Repeat Every or cron expression) | New version covering the configured lookback period on each run |
| Inference data backfill | New version covering the backfilled range |
Each version's range_start and range_end indicate the inference time window it covers — not when the computation ran (created_at).
Next Steps
| Goal | Where to go |
|---|---|
| Trigger a metrics refresh | Dashboard — Refresh button |
| Write chart SQL with segmentation | Custom Graphs |
| Understand the full metrics schema | Metrics Overview & Data Model |
| Alert when a metric drops below threshold | Alerts & Alert Rules |
Updated 2 months ago