Arthur + LlamaIndex
How does a developer instrument a LlamaIndex RAG pipeline with Arthur in under 10 minutes? You install the Arthur Observability SDK with the llama-index extra, initialize the Arthur client, call instrument_llama_index(), and run your pipeline as usual. Arthur automatically captures every retrieval, embedding, and LLM span using the OpenInference standard — giving you full visibility into which chunks were retrieved, how the query engine scored them, and what the LLM generated. No manual span creation required.
Overview
LlamaIndex is one of the most popular RAG frameworks — teams building retrieval pipelines need traces that show which chunks were retrieved, what the query engine scored, and what the LLM generated. Arthur's OpenInference support captures all of this automatically.
When you call arthur.instrument_llama_index(), the SDK registers an OpenInference instrumentor that hooks into LlamaIndex's internal callback system. Once instrumented, you get full visibility into:
- Retrieval — query text, retrieved chunks, relevance scores
- Embeddings — input text, model name, vector dimensions
- LLM completions — prompt messages, completion text, token usage, model parameters
- Query engine orchestration — the full chain from query to final answer
- Session and user context — group traces by conversation or end-user
sequenceDiagram
    participant App as Your Application
    participant SDK as Arthur SDK
    participant LI as LlamaIndex
    participant Engine as Arthur GenAI Engine

    App->>SDK: arthur.instrument_llama_index()
    Note over SDK: Auto-instrumentation enabled
    App->>LI: query_engine.query(...)
    LI-->>App: Response
    SDK->>Engine: Trace (spans, attributes)
    Note over Engine: Traces visible in dashboard
Prerequisites:
- Python 3.10+
- An Arthur GenAI Engine instance (cloud or local)
- An Arthur API key — see API Keys to create one
Installation
Install the Arthur Observability SDK with the llama-index extra:
pip install "arthur-observability-sdk[llama-index]"This pulls in openinference-instrumentation-llama-index and its dependencies automatically.
Initialize Arthur
Create a single Arthur instance at application startup.
from arthur_observability_sdk import Arthur

arthur = Arthur(
    api_key="your-api-key",        # or set ARTHUR_API_KEY env var
    base_url="https://your-arthur-engine-instance",  # or set ARTHUR_BASE_URL env var
    task_id="<your-task-uuid>",    # Arthur task UUID
    service_name="my-llamaindex-app",
)| Parameter | Description |
|---|---|
api_key | Your Arthur Engine API key. Falls back to ARTHUR_API_KEY env var. |
base_url | Base URL of your Arthur GenAI Engine. Falls back to ARTHUR_BASE_URL env var, then http://localhost:3030. |
task_id | Arthur task UUID for associating traces with a specific task. |
service_name | OpenTelemetry service.name resource attribute. Used to identify your application in the Arthur dashboard. Creates a new task based on service_name if task_id isn't specified. |
At least one oftask_idorservice_namemust be provided. A new task with theservice_namewill be created iftask_idis not specified.
Use environment variables for secrets. SetARTHUR_API_KEYandARTHUR_BASE_URLas environment variables (e.g., in a.envfile) rather than hardcoding them in your application.
Instrument LlamaIndex
A single method call enables automatic tracing for your entire LlamaIndex pipeline. Call this before you build any indexes or run any queries.
from llama_index.core import VectorStoreIndex, SimpleDirectoryReader
from arthur_observability_sdk import Arthur

# 1. Initialize Arthur
arthur = Arthur(
    api_key="your-api-key",
    base_url="https://your-arthur-engine-instance",
    task_id="<your-task-uuid>",
    service_name="my-llamaindex-app",
)

# 2. Instrument LlamaIndex
arthur.instrument_llama_index()

# 3. Build your RAG pipeline as usual
documents = SimpleDirectoryReader("./data").load_data()
index = VectorStoreIndex.from_documents(documents)

# 4. Query — traces are captured automatically
query_engine = index.as_query_engine()
response = query_engine.query("What does Arthur do?")
print(response)

# 5. Shut down cleanly (flushes pending spans)
arthur.shutdown()
Key points:
instrument_llama_index()patches LlamaIndex globally — you do not need to wrap individual queries.- Every retrieval, embedding, and LLM call is automatically traced with the full parent-child span hierarchy.
- Call
arthur.shutdown()when your application exits to flush any remaining traces.
Trace Index and Query Operations
When you run query_engine.query(...), Arthur captures a trace with the following span hierarchy:
flowchart TD
    A["CHAIN: query"]
    A --> B["RETRIEVER: retrieve"]
    B --> C["EMBEDDING: embed query"]
    A --> D["LLM: synthesize"]
Each span includes rich attributes:
- RETRIEVER spans — the query text, each retrieved document chunk, and relevance scores
- EMBEDDING spans — the input text, embedding model name, and vector dimensions
- LLM spans — the full prompt messages, completion text, token usage, and model name
Add Session and User Context
Use arthur.attributes() as a context manager to tag traces with session IDs, user IDs, and custom metadata. This enables filtering and grouping in the Arthur platform.
with arthur.attributes(session_id="sess-1", user_id="user-42"):
    response = query_engine.query("What does Arthur do?")
This is especially useful for:
- Multi-turn conversations — trace an entire chat session end-to-end
- Per-user analytics — understand how individual users interact with your application
- Debugging — filter traces in the Arthur dashboard by session or user
You can also tag traces with custom metadata for A/B testing retrieval strategies:
with arthur.attributes(session_id="experiment-1", metadata={"strategy": "hybrid-search"}):
    response = query_engine.query("What does Arthur do?")
Verify in Arthur
After running your pipeline, traces appear in the Arthur GenAI Engine within seconds.
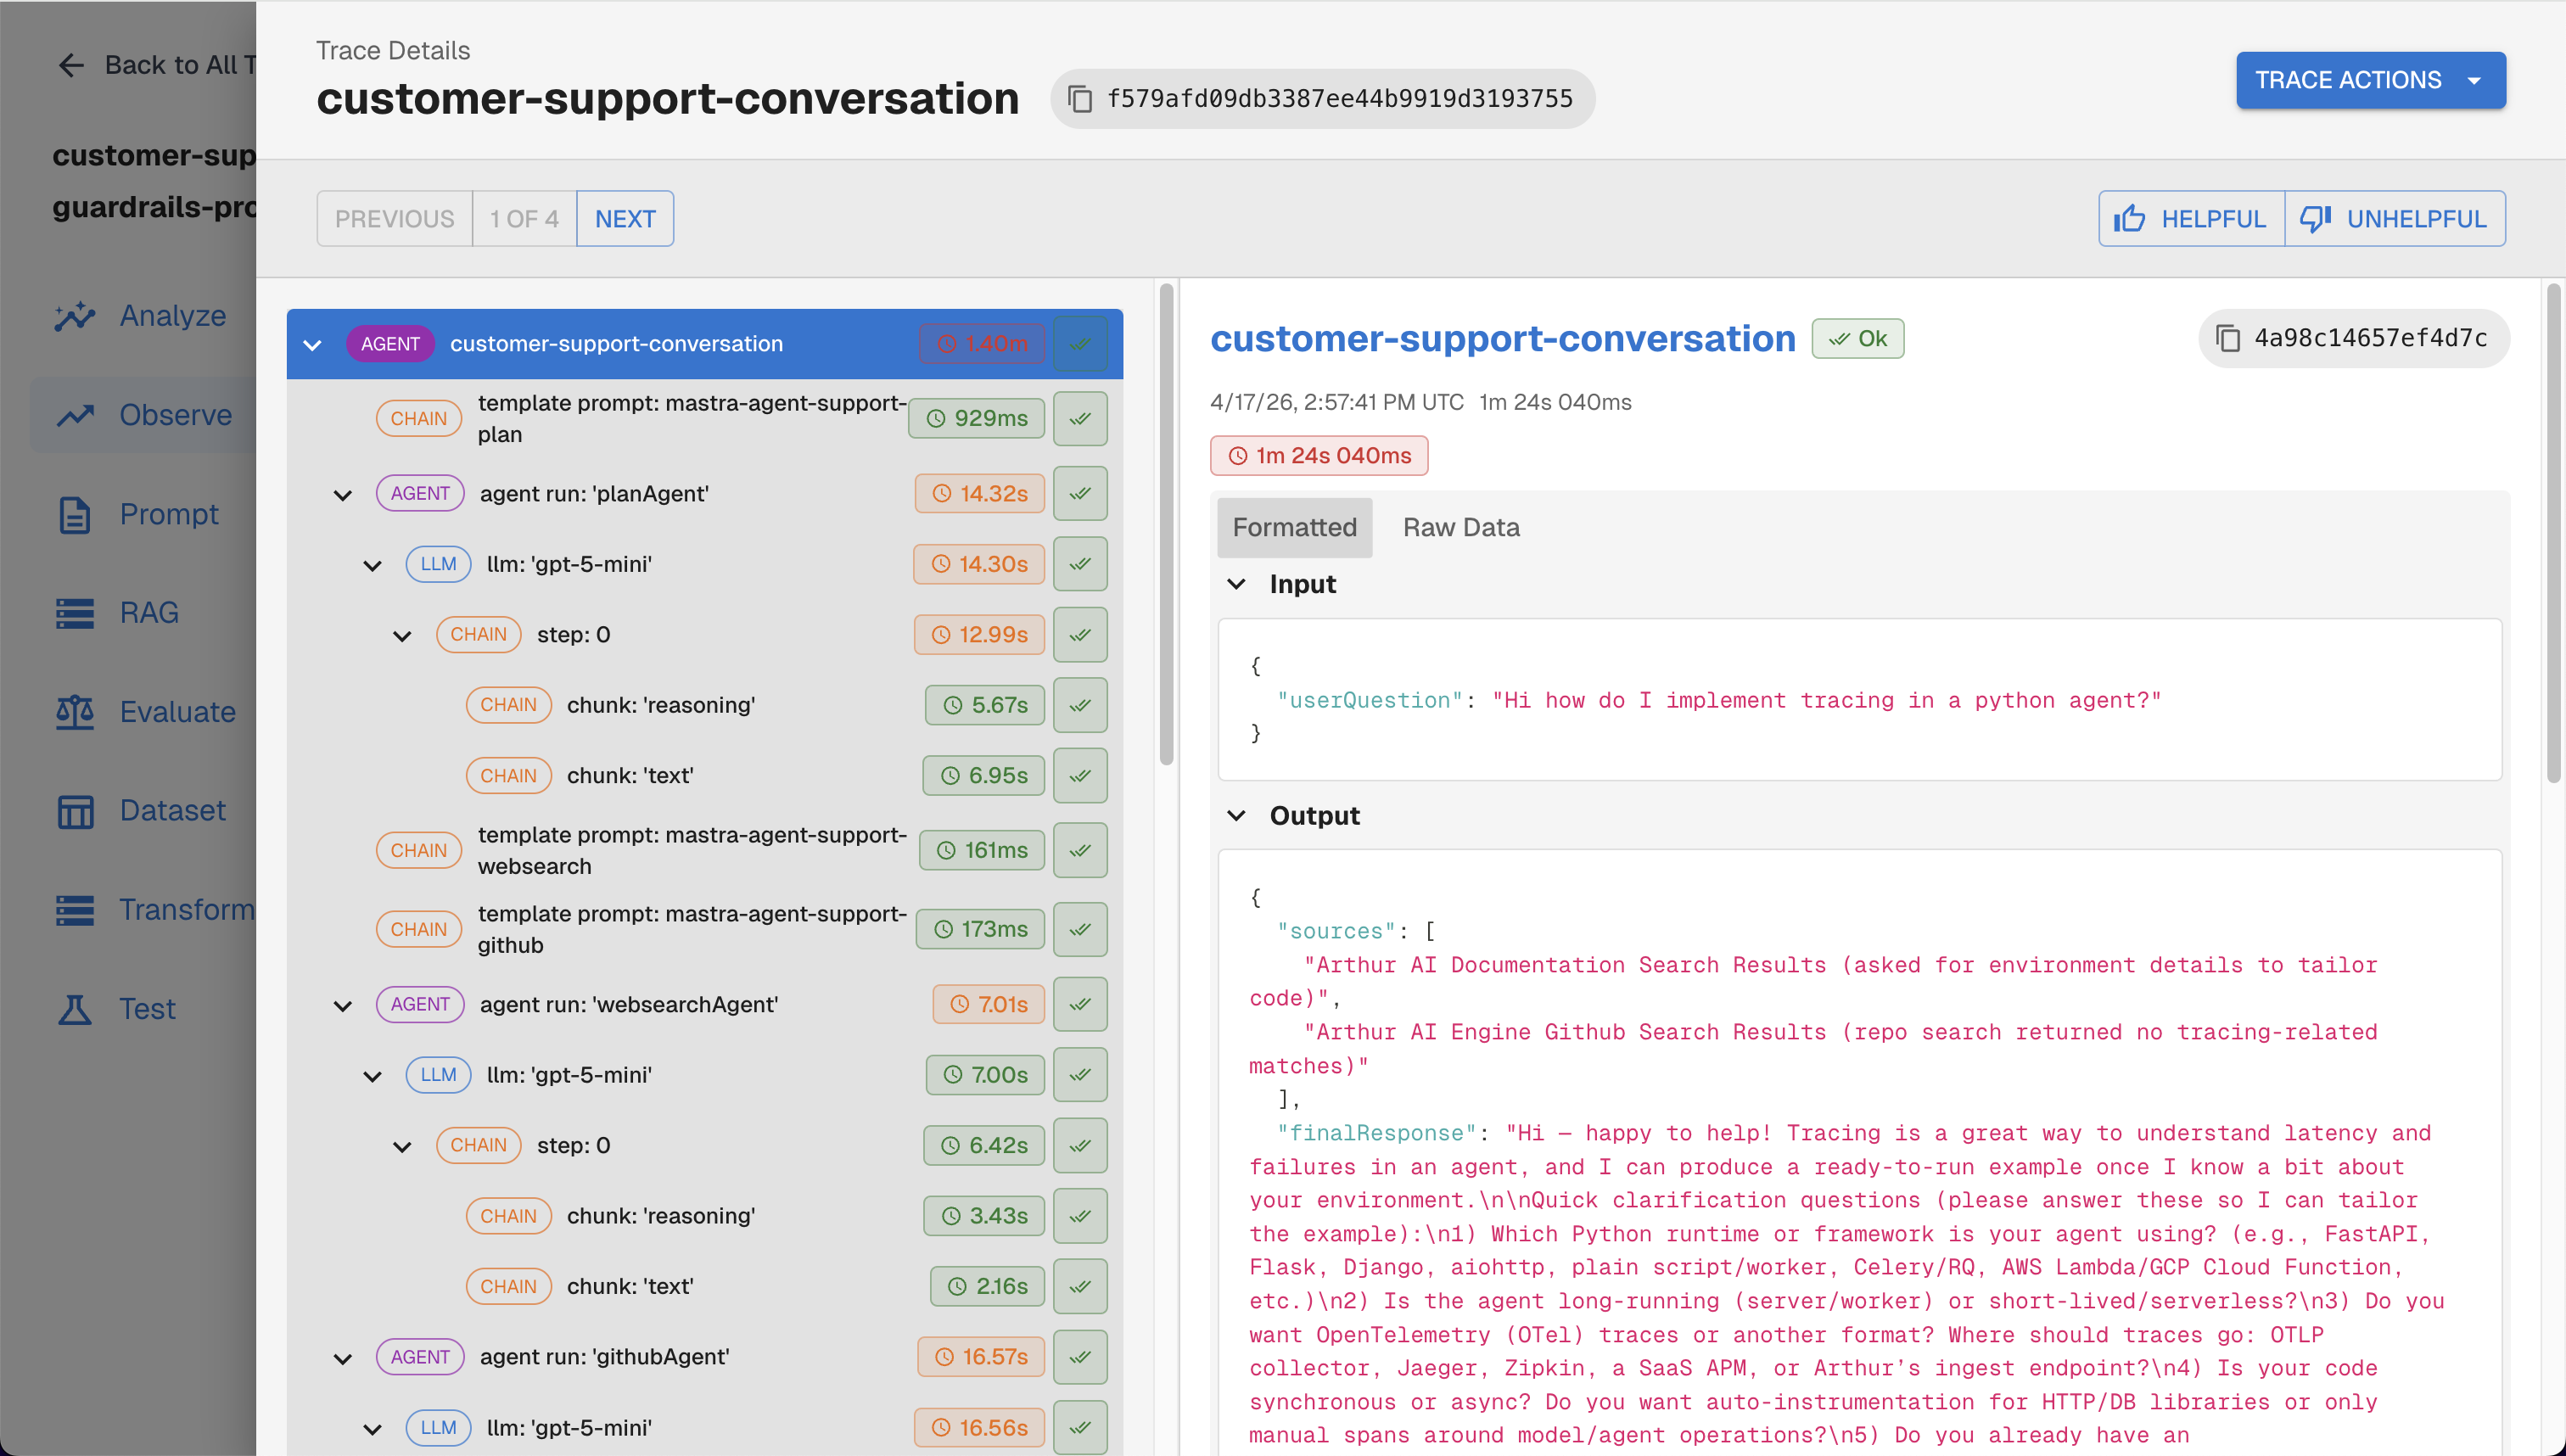
Traces viewed on the Arthur Engine UI
What to look for in the dashboard:
- Trace list — each
query()call appears as a trace with the full retrieval/embedding/LLM span tree - Span hierarchy — each query shows a CHAIN root span with RETRIEVER and LLM child spans
- Retrieved documents — click into a RETRIEVER span to see the chunks that were returned and their scores
- LLM inputs/outputs — click into an LLM span to see the full prompt and completion text
You can also query traces programmatically:
curl -X GET "${ARTHUR_BASE_URL}/api/v1/traces?task_ids=${ARTHUR_TASK_ID}" \
  -H "Authorization: Bearer ${ARTHUR_API_KEY}"
Troubleshooting
| Symptom | Fix |
|---|---|
| No traces appearing | Verify ARTHUR_API_KEY and ARTHUR_BASE_URL are correct and your Arthur Engine is reachable. |
| Missing retrieval/embedding spans | Call arthur.instrument_llama_index() before building any indexes or running queries. |
| Traces delayed | Traces are exported asynchronously via BatchSpanProcessor; allow a few seconds, or call arthur.shutdown() to flush. |
ImportError on instrument | Run pip install "arthur-observability-sdk[llama-index]" to install the required extra. |
Next Steps
Now that your LlamaIndex pipeline is instrumented, explore these capabilities:
- Continuous Evaluations — automatically score retrieval quality, faithfulness, and answer relevance on every trace
- Prompt Management — version and manage your LlamaIndex prompt templates with
arthur.get_prompt() - Agentic Experiments — run structured experiments to compare retrieval strategies or prompt variations
- Read our Best Practices for Building Agents Blog Series — observability and tracing fundamentals for building production agents
- Other Integrations — if your pipeline also uses LangChain or direct OpenAI calls, layer additional instrumentors alongside LlamaIndex
flowchart LR
    A[Instrument LlamaIndex] --> B[View Traces]
    B --> C[Add Evaluations]
    B --> D[Manage Prompts]
    C --> E[Set Up Continuous Evals]
    D --> F[A/B Test Prompts]
    E --> G[Production Monitoring]
    F --> G
Updated 2 months ago